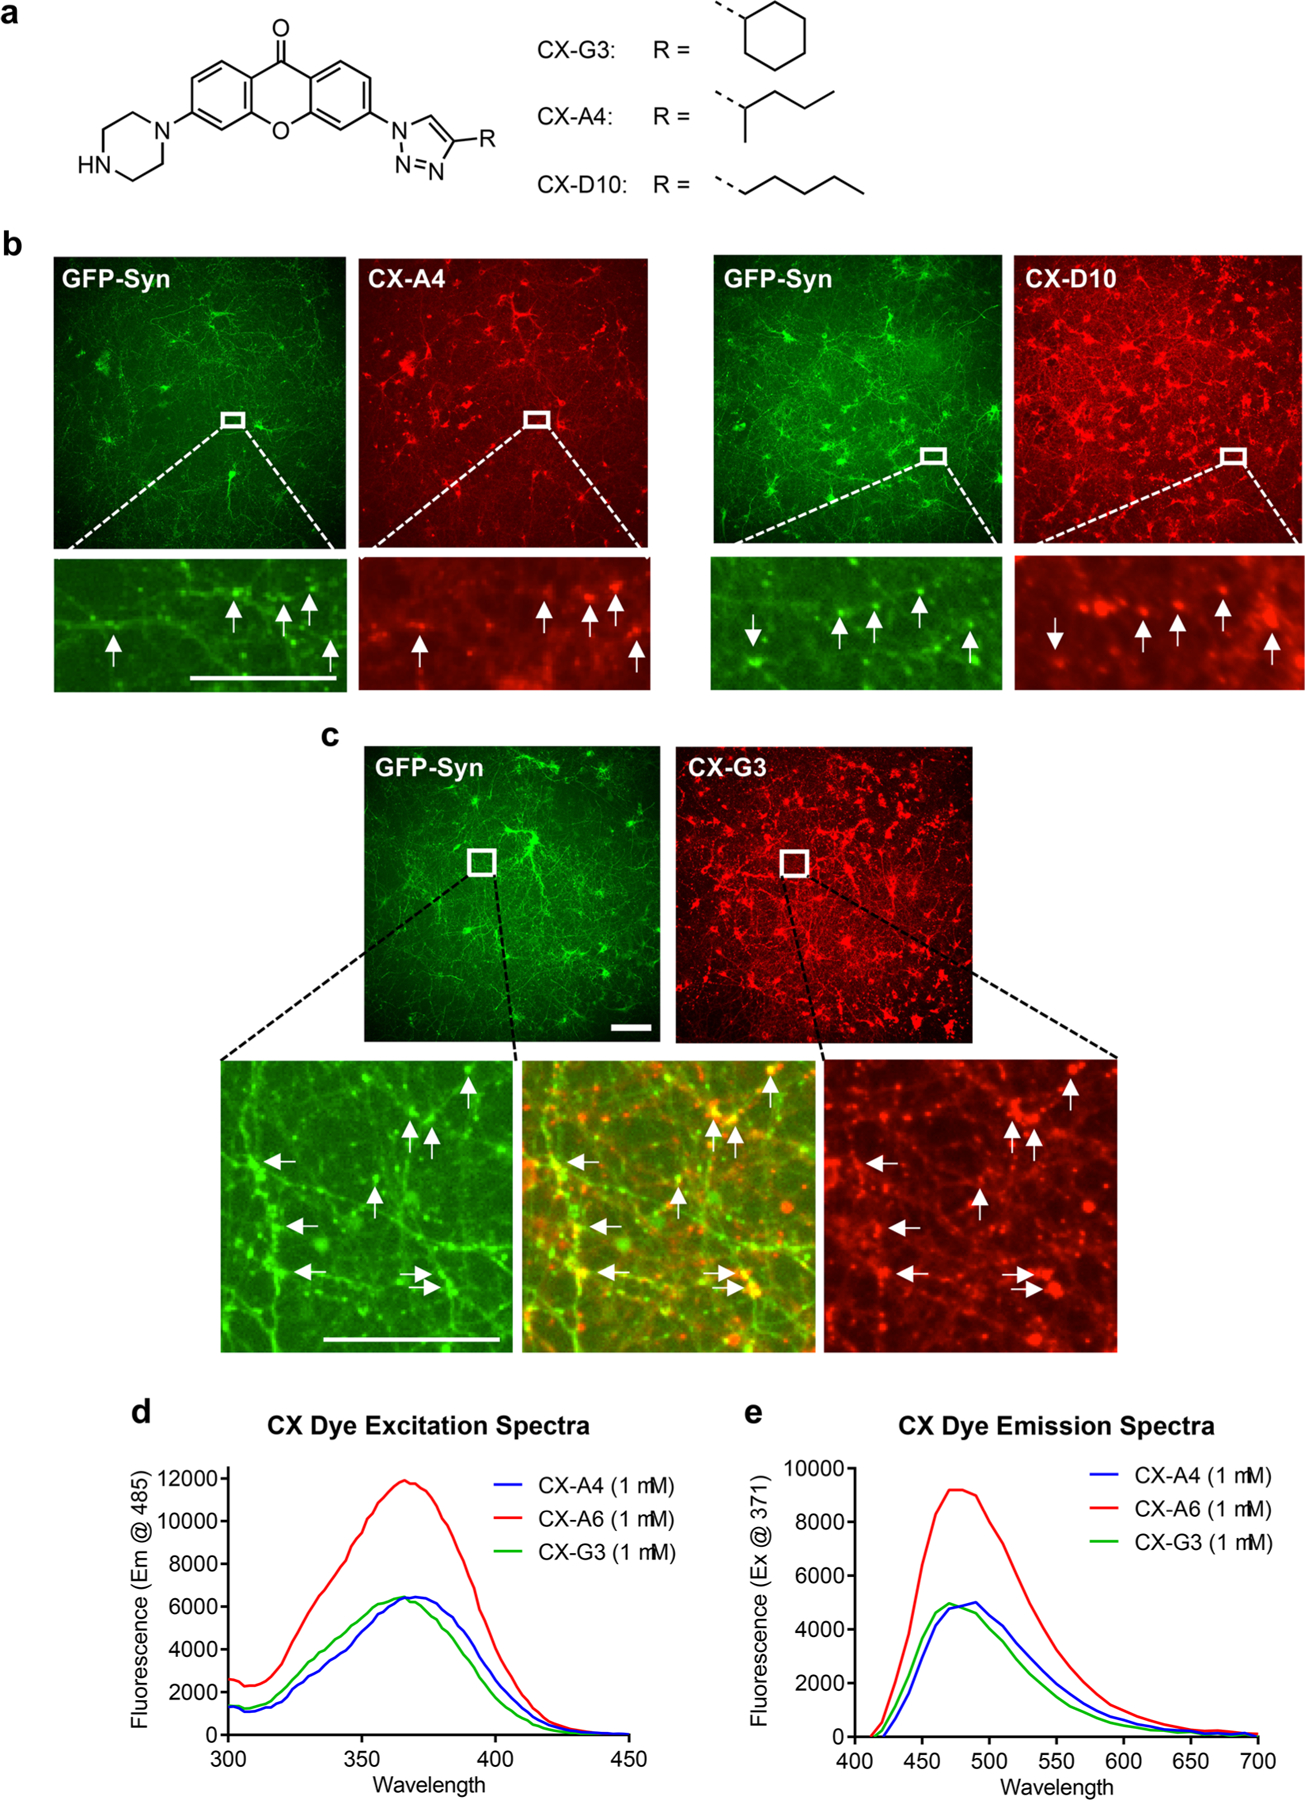
Figure 2.

CX xanthone compounds exhibit colocalization with GFP-Syn synaptic marker. (a) Structure ofxanthone core and the R groups from CX-G3, A4, and D10 compounds. (b) Original and zoomed screening images of CX-A4 and CX-D10 with GFP-Syn in cortical neurons. Arrows indicate sites of colocalization. Size bar is 100 μm for original image, 25 μm for zoomed image. (c) Original and zoomed images of CX-G3, which has the highest GFP-Syn colocalization of the CX compounds. Arrows indicate sites of colocalization. Size bar is 100 μm for original image, 50 μm for zoomed image. (d,e) Excitation and emission spectra of select CX compounds in DMSO. Excitation spectra were measured with emission at 485 nm; emission spectra with excitation at 371 nm.
