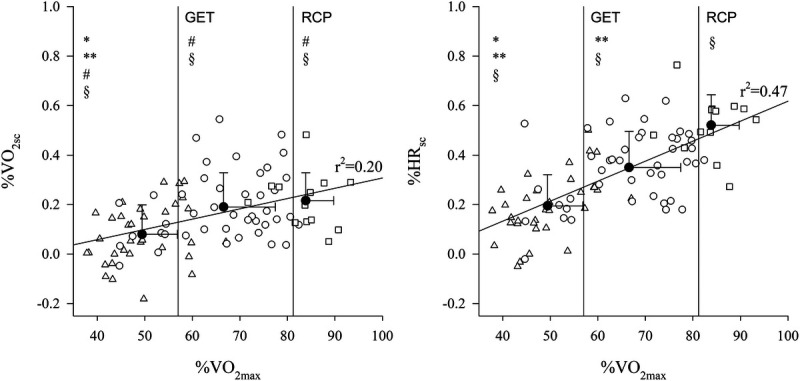
FIGURE 2.

Individual data (white symbols) of %slow component per minute of oxygen uptake (V˙O2; left panel) and HR (right panel) are plotted as a function of %V˙O2max. Data points falling in the moderate domain are indicated by (Δ) in the heavy domain by (○) and in the severe domain by (□). Regression lines with the coefficient of determination are shown. The two vertical lines in each panel indicate the group-average value of GET and RCP, expressed as %V̇O2max. The three black dots (●) in each graph indicates mean ± SD values of %scV̇O2 and %HR grouped by intensity domain. Relative to each domain group, *indicates a significant difference from heavy and **from the severe domains; #indicates a significant difference from %scHR within the same domain; §indicates a significant difference from “0.”
