. 2021 Nov 23;54(4):633–645. doi: 10.1249/MSS.0000000000002832
Copyright © 2021 The Author(s). Published by Wolters Kluwer Health, Inc. on behalf of the American College of Sports Medicine.
This is an open-access article distributed under the terms of the Creative Commons Attribution-Non Commercial-No Derivatives License 4.0 (CCBY-NC-ND), where it is permissible to download and share the work provided it is properly cited. The work cannot be changed in any way or used commercially without permission from the journal.
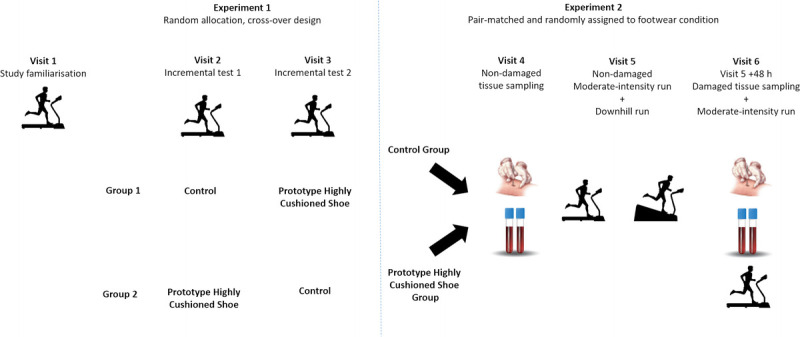
FIGURE 1.

Schematic illustration of the study visits for experiments I and II.
