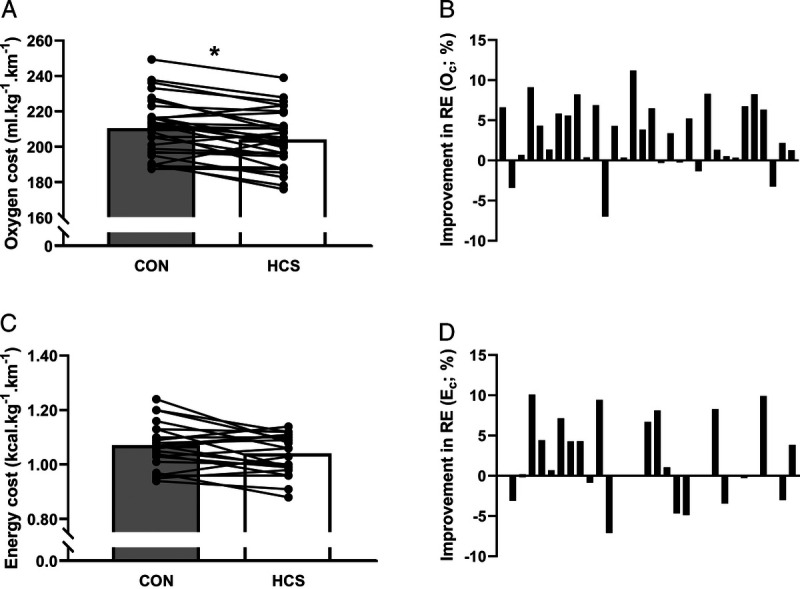
FIGURE 3.

Effect of footwear (CON, gray; HCS, white) on running economy during the incremental treadmill test. The mean Oc (A) and Ec (B) across all speeds are shown for the group and each individual for all speeds where a valid running economy had been attained in both footwear conditions within-participant. The within-participant change in running economy is displayed for Oc (C) and Ec (D). *P < 0.05.
