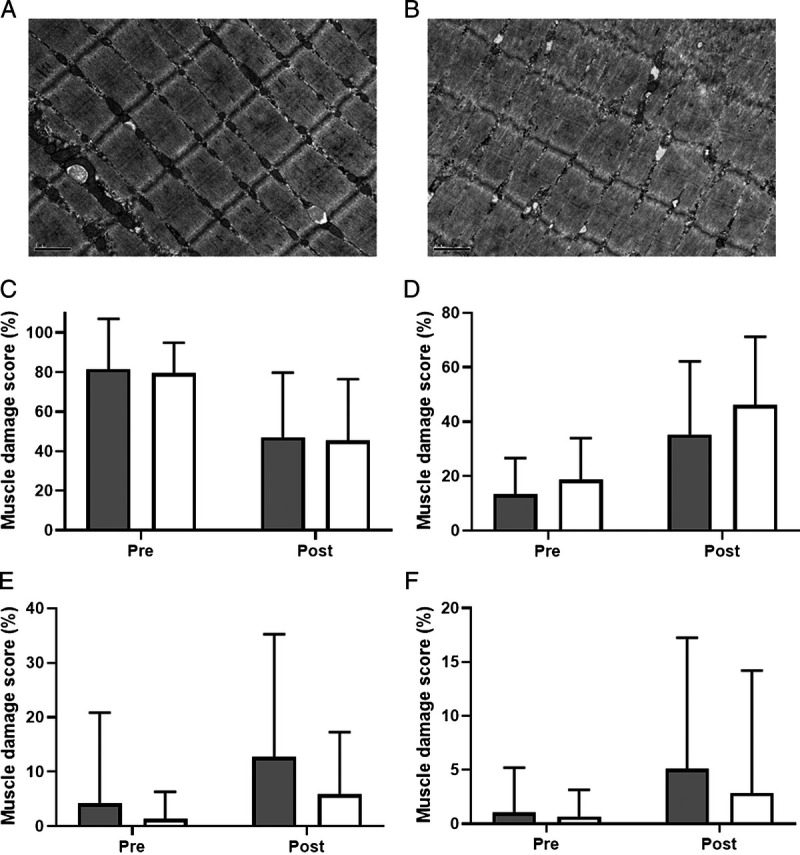
FIGURE 4.

Representative electron micrographs of longitudinal skeletal muscle sections pre- (A) and 48 h post- (B) downhill running in the CON condition, and the group mean (±SD) TEM ratings of muscle damage (C–F) for CON (gray columns) and HCS (white columns). Each TEM image was scored according to the absence (C) or presence (D) of wavy Z-disk, mild Z-disk streaming (E), or disintegration of the Z-disk (F), and the percentage of images corresponding to each rating was subsequently determined for each participant. *Main effect for time, P < 0.05.
