
FIGURE 5.
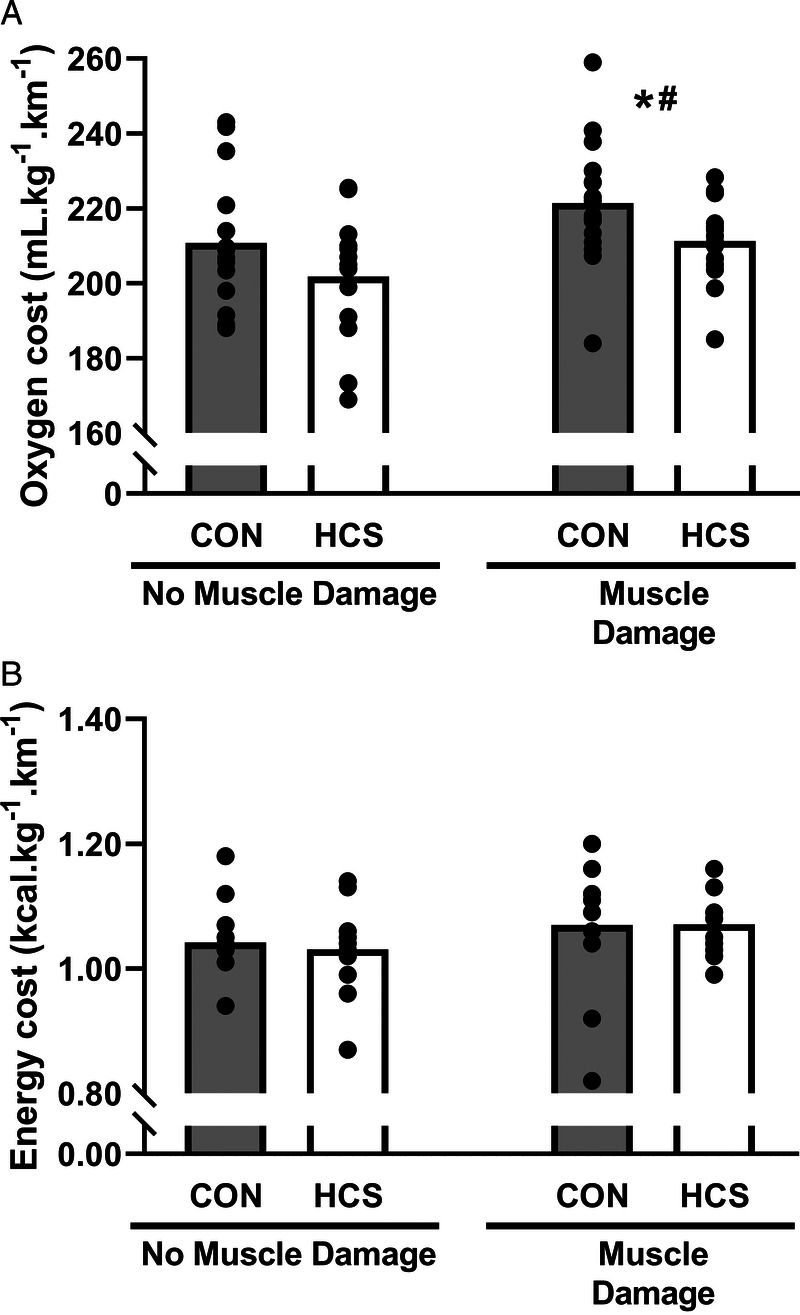
Oc (A) and energy cost (B) of running at sLT (10.4 ± 1.8 km·h−1) before and 48 h after the downhill run for CON and HCS. *Within-group effect for time, P < 0.05. #Between-group effect, P < 0.05.
Official websites use .gov
A
.gov website belongs to an official
government organization in the United States.
Secure .gov websites use HTTPS
A lock (
) or https:// means you've safely
connected to the .gov website. Share sensitive
information only on official, secure websites.
Oc (A) and energy cost (B) of running at sLT (10.4 ± 1.8 km·h−1) before and 48 h after the downhill run for CON and HCS. *Within-group effect for time, P < 0.05. #Between-group effect, P < 0.05.