Figure 1.
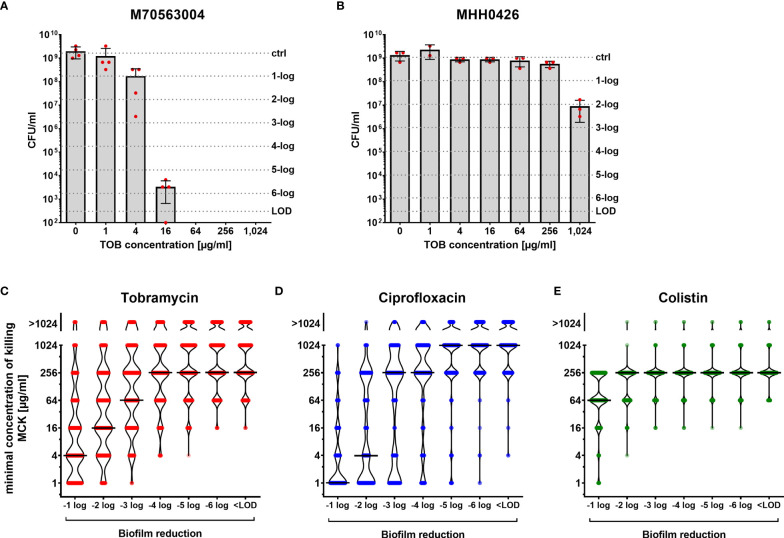
Concentration-dependent killing of biofilm-grown clinical P. aeruginosa isolate cells. Isolate-specific killing profiles are exemplarily shown for two tobramycin susceptible clinical isolates, which exhibit the same minimal inhibitory concentration (MIC) value (MIC = 1 µg/ml). M70563004 biofilm-grown cells are responsive to tobramycin treatment (A), whereas MHH0426 biofilm-grown cells are far less responsive (B). Mean and standard deviations of the CFU/ml following the antibiotic treatment of biofilm-grown cells at the indicated tobramycin concentrations for 24 h are depicted. Results of the individual independent experiments are indicated by red dots (n = 4 for M70563004; n = 3 for MHH0426). The antibiotic concentration (minimal concentration of killing, MCK) that was required to lead to a 1-log, 2-log, 3-log, 4-log, 5-log, and 6-log unit reduction (dashed lines) in colony forming units (CFU) as compared to the untreated growth control can be deduced. The violin plots (C–E) depict the minimal concentrations of killing (MCK) to achieve a 1-log, 2-log, 3-log, 4-log, 5-log, 6-log unit reduction in colony forming units (CFU), and eradication below the limit of detection (< LOD), respectively for all 352 clinical isolates. Black lines indicate the median MCKs of tobramycin (C), ciprofloxacin (D) and colistin (E). Each dot represents one clinical isolate. TOB, tobramycin; CIP, ciprofloxacin; COL, colistin; LOD, limit of detection.

