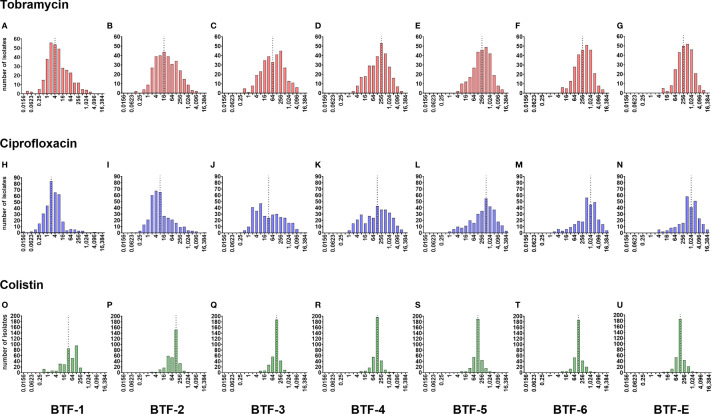
Figure 3.
Histograms of the biofilm tolerance factors (BTFs) of the individual clinical isolates. Distributions of biofilm tolerance factors (BTF) by which the minimal inhibitory concentration (MIC) has to be multiplied to achieve a reduction in the CFUs of the individual biofilm-grown clinical isolates by 1-log (BTF-1), 2-log (BTF-2), 3-log (BTF-3), 4-log (BTF-4), 5-log (BTF-5), 6-log (BTF-6) reduction and eradication below the detection limit (BTF-E), respectively, are shown for tobramycin (A–G), ciprofloxacin (H–N), and colistin (O–U). Tested clinical isolates: n = 352. BTF = MCK/MIC. Graphs only include strains with discrete BTF, where the highest antibiotic concentration tested (1,024 µg/ml) resulted in the indicated reduction of biofilm CFU. Median biofilm tolerance factors are indicated by a dashed line.

