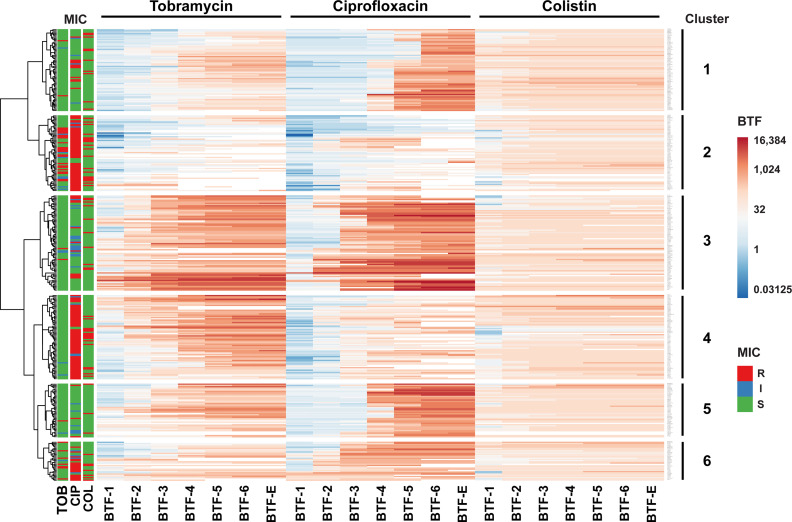
Figure 5.
Hierarchical clustering of biofilm tolerance factors. The 352 clinical isolates were clustered based on their biofilm tolerance factors for all three antibiotics. The result of the hierarchical clustering calculation is displayed in a heat map and uncovers six groups of strains (indicated on the right) that exhibit similar tolerance patterns. Hierarchical clustering was based on log2-transformed BTFs, using Euclidian distance and Ward linkage in ClustVis (Metsalu and Vilo, 2015). Only discrete BTFs are shown, where the highest antibiotic concentration tested (1,024 µg/ml) resulted in a measurable reduction of CFUs. The MIC-based susceptibility profiles of clinical isolates (according to CLSI breakpoints) are displayed on the left. R, resistant (marked in red); I, intermediate (blue); S, susceptible (green).

