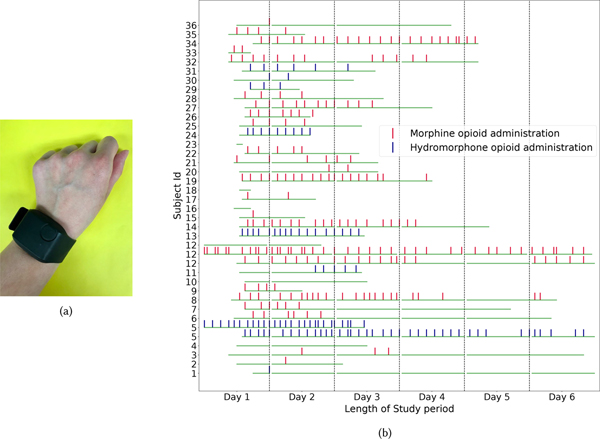
Fig. 1.
(a) Picture of E4 sensor. (b) Plot showing the distribution and timeline of opioid administration events per subject (hourly-basis). If a subject was enrolled for more than 6 days (subjects 5 and 12), we used multiple rows. The Green horizontal bar indicates the start, end, and total duration of sensing data collected.

