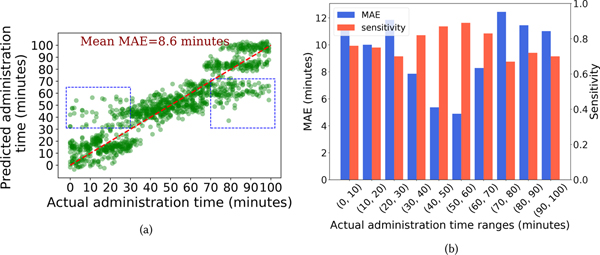
Fig. 7.
(a) Scatter plot of actual administration moment and predicted administration moment by the CTA-TCN model. Small Gaussian noise is added to the predicted times to enhance visualization. (b) Barplot showing the model’s MAE and sensitivity performance across different time ranges of ground truth administration moment.

