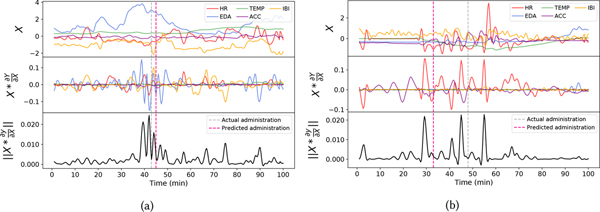
Fig. 9.
Example plot showing the output from Gradient*input to demonstrate importance of modality and temporal information for prediction. The topmost plot shows the input X considered for this experiment, the middle plot shows the Gradient*input for this input, and in the bottom plot, we take the magnitude of all the features of Gradient*input along the temporal direction. For the sake of visualization, we used unstandardized data to plot X.

