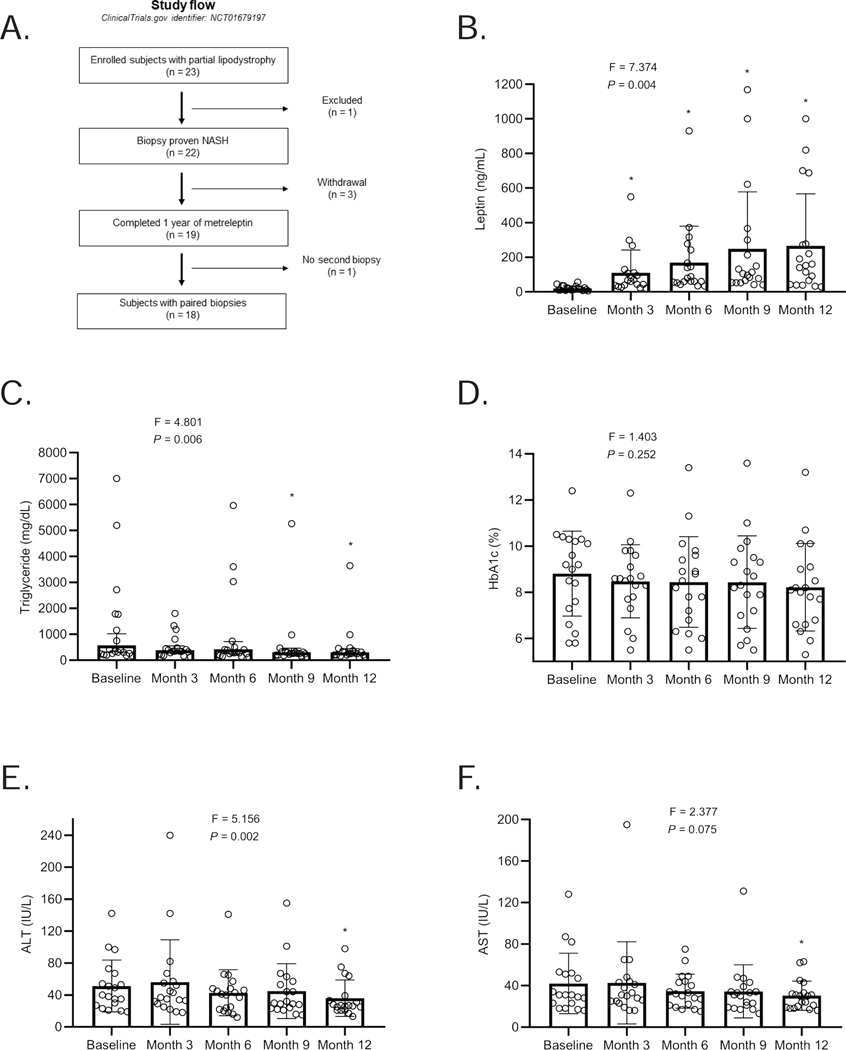
Figure 3. Leptin levels, study design, and the effect of metreleptin on metabolic parameters and liver enzymes over the 12-month treatment period in the PL study.
(A) Leptin levels throughout the PL study period. Leptin levels were measured from three samples measured 30 minutes apart at baseline, and 3, 6, 9, and 12 months after metreleptin. The levels shown are average leptin levels. The F-statistic and P value are reported from a repeated-measures ANOVA. *These P values are marked if they are significant versus baseline with post hoc paired sample t-test after multiplicity correction. Paired t-test was used to compare month-12 values to baseline (without multiplicity correction) as the change at 12 months vs. baseline was a prespecified endpoint; (B) Patient progression through the PL study. A total of 23 patients with partial lipodystrophy were enrolled and 22 had biopsy-proven NASH. Of the 22 patients, 3 withdrew from the study and 19 completed 1 year of metreleptin treatment. 18 patients completed the 12-month post-treatment biopsy; (C) Triglycerides; (D) HbA1c; (E) ALT; and (F) AST levels in subjects with partial lipodystrophy treated with metreleptin for 1 year. The F-statistic and P value are reported from a repeated-measures ANOVA. *These P values are marked if they are significant versus baseline with post hoc paired sample t-test after multiplicity correction. Paired t-test was used to compare month-12 values to baseline (without multiplicity correction) as the change at 12 months vs. baseline was a prespecified endpoint. Tests are run on log transformed data for triglycerides, ALT and AST. Triglycerides are shown geometric mean with 95 % confidence intervals (CI), otherwise, the data are reported as mean ± SD. The last observed non-missing values (month 6) is used to fill in missing values at month 9 visit in one subject (subject ID: 21) who missed month 9 visit but completed the study protocol.

