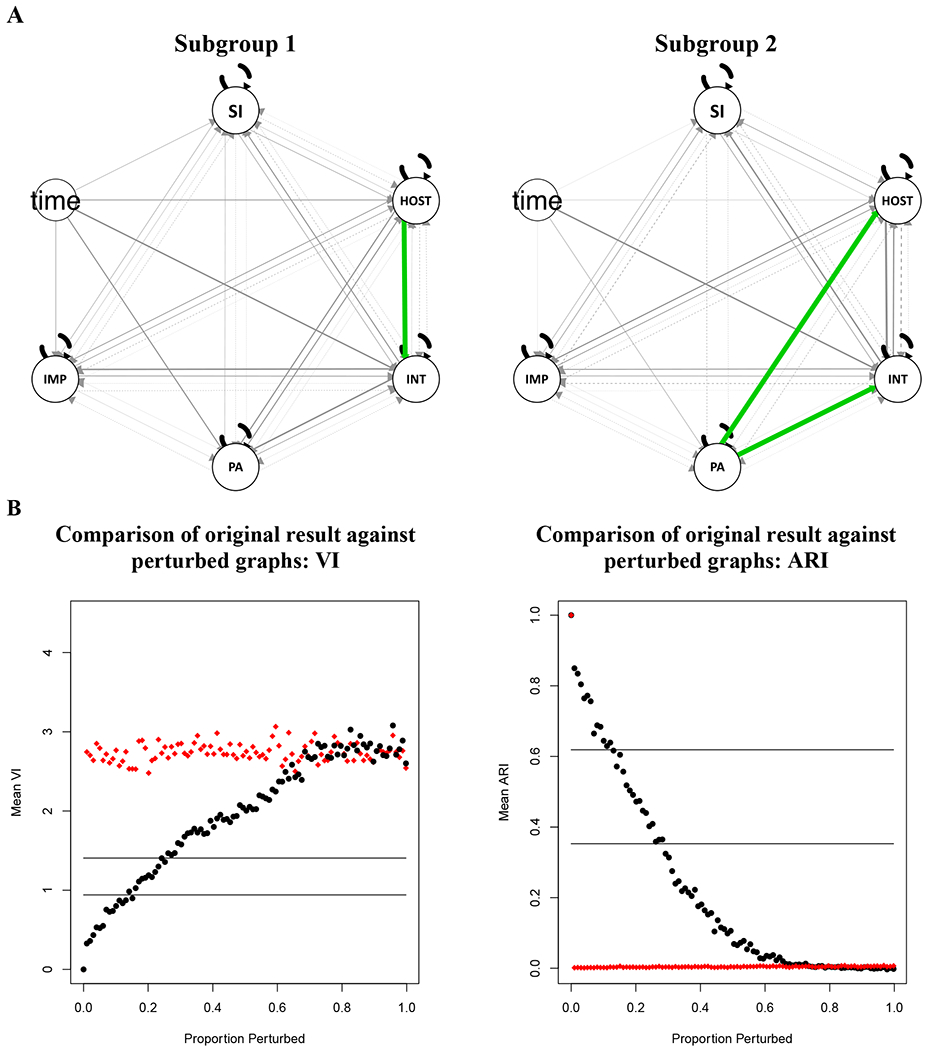
Figure 1.

A: Depiction of subgroup- and individual-level paths assessed via GIMME. SI = suicidal ideation; HOST = hostility; INT = internalizing negative affect; PA = positive affect; IMP = impulsivity; Grey paths represent individual-level estimates and green paths subgroup-level estimates. Line thickness corresponds to the number of individuals that share the same path proportionate to the total group size. Contemporaneous effects are represented with solid lines, and lagged effects are represented with dashed lines. B: Subgroup validation results based on VI and ARI. The horizontal lines indicate difference between solutions where 10% (bottom) and 20% (top line) of the nodes are randomly switched to different clusters. Black dots represent the perturbed graph based on the original clustering solution; red rhombi represent a perturbed random graph.
