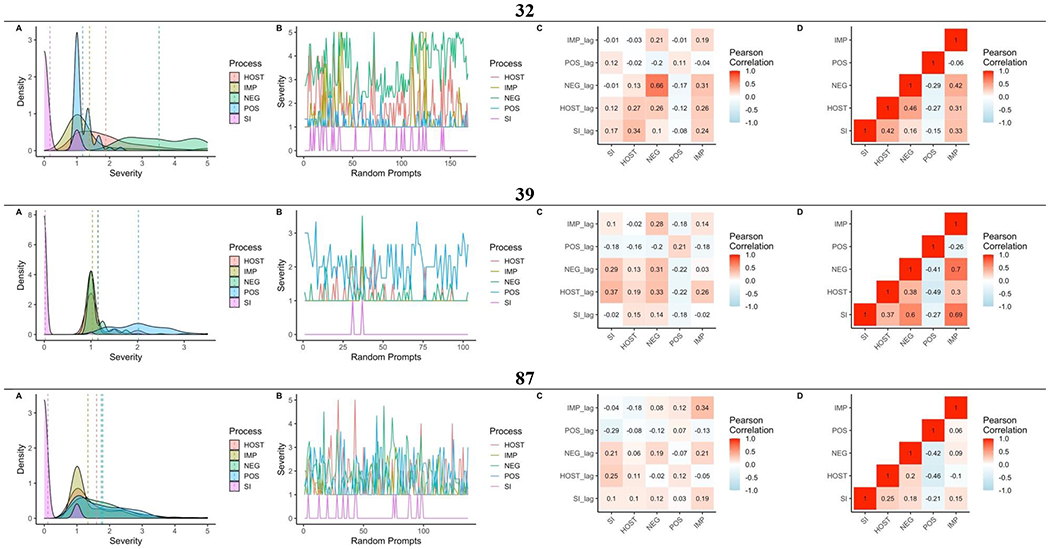
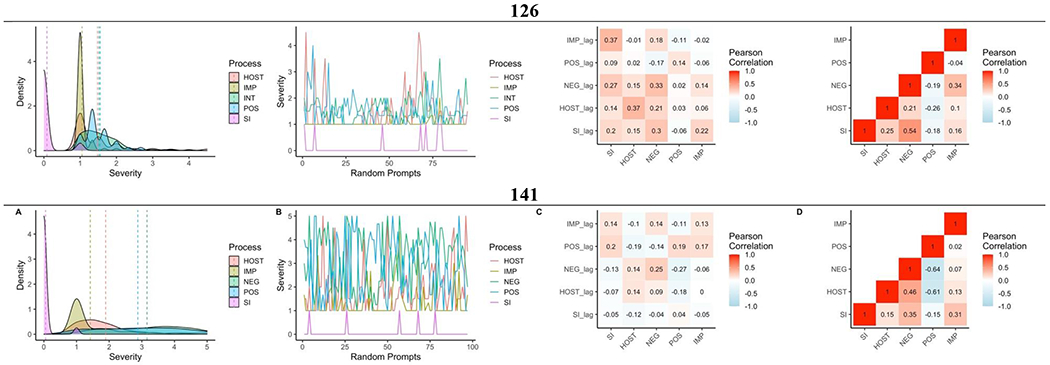
Figure 3.


A: Kernel density plots with vertical dashed lines denoting mean values, B: time-series plots, correlation heat maps of C: lagged (diagonal reflects autocorrelation) and D: contemporaneous associations of daily assessed suicidal ideation (SI), hostility (HOST), negative affect (NEG), positive affect (POS), and impulsivity (IMP) for five participants.
