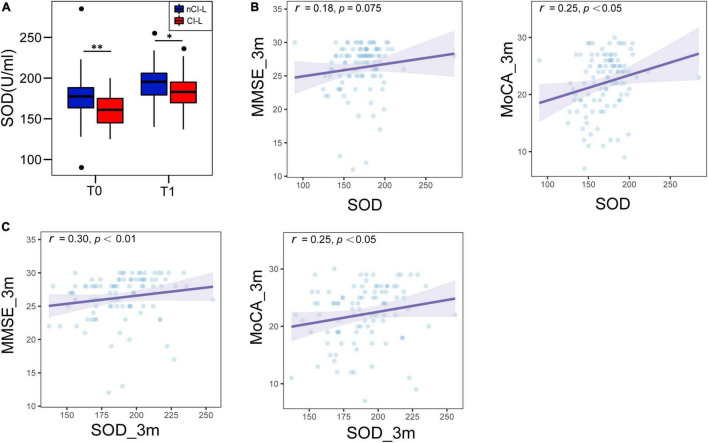
FIGURE 3.
Comparison of serum SOD levels between CI-L and nCI-L and the association between SOD and cognitive scores at follow-up. (A) Comparison of SOD levels (both baseline and 3-month follow-up) in the CI-L group and nCI-L group. (B) Associations between serum SOD (baseline) and cognitive scores (MMSE and MoCA at follow-up). (C) Associations between serum SOD (follow-up) and cognitive scores (MMSE and MoCA at follow-up). CI-L, late cognitive impairment after stroke; nCI-L, non-late cognitive impairment after stroke. *P < 0.05, **P < 0.01.

