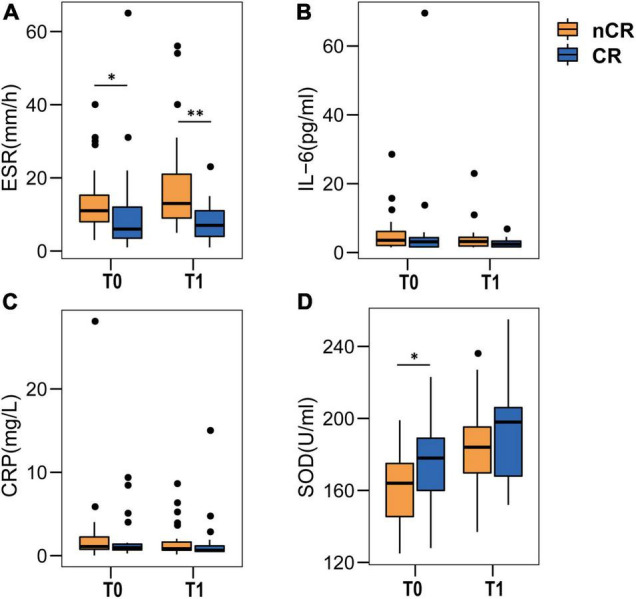
FIGURE 5.

Comparison of systemic inflammatory biomarkers and serum SOD levels between CR and nCR. (A–C) Comparison of systemic inflammation biomarkers. Compared to the CR group, ESR, CRP, and IL-6 (A–C) increased in the nCR group at baseline (T0), especially ESR levels, which were consistently (T0 and T1) higher in the nCR group (A). (D) Comparison of serum SOD levels. SOD was continuously lower in the nCR group, especially at baseline. T0 means baseline, T1 means 3-month follow-up. ESR, IL-6, CRP, and SOD at baseline and 3 months were compared between two groups by Mann-Whitney U test. *P < 0.05, **P < 0.01.
