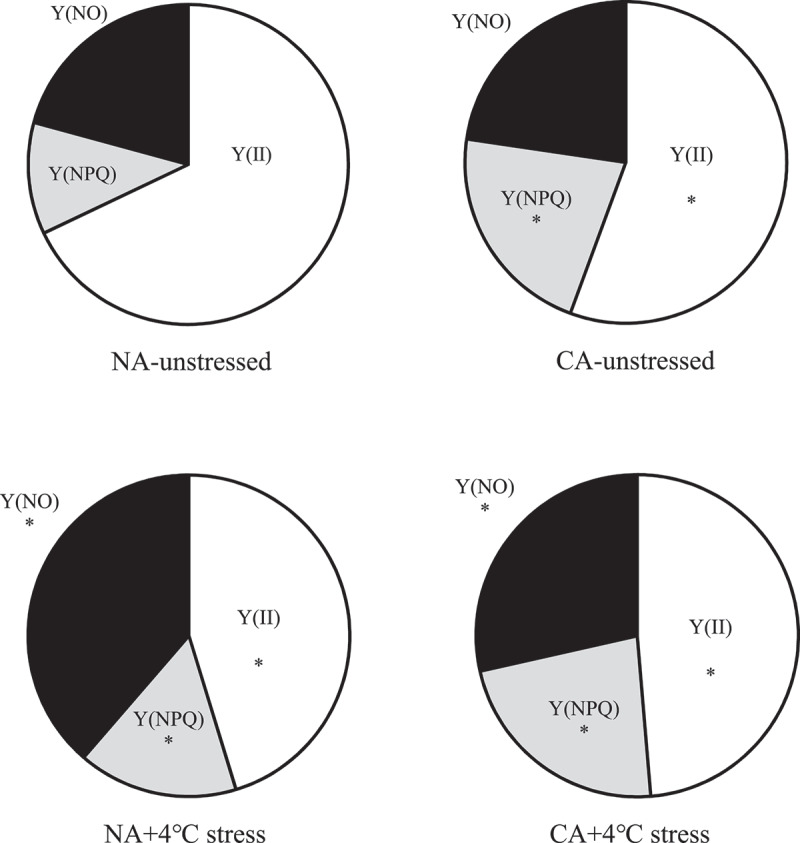
Figure 3.

Cold acclimation on Y(II), Y(NPQ) and Y(NO) with and without cold stress in tobacco leaves.
Note. The data in the figure is an average of three replicated samples. *Showed significant difference between treatment and NA-unstressed (P < .05), ns showed no significant difference between treatment and NA-unstressed (P > .05).
