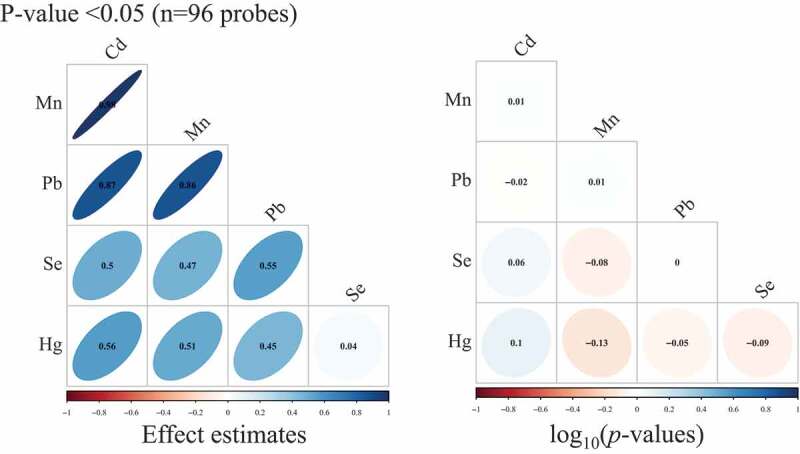
Figure 2.

Pearson correlation matrices for effect estimates and Spearman correlation matrices for – log10(p-values) from single-site analyses of cadmium (Cd), manganese (Mn), lead (Pb), selenium (Se), and total mercury (Hg), where we restricted to only CpG sites that had p-value <0.05 in models of Cd, Mn, and Pb. (n = 97 samples).
