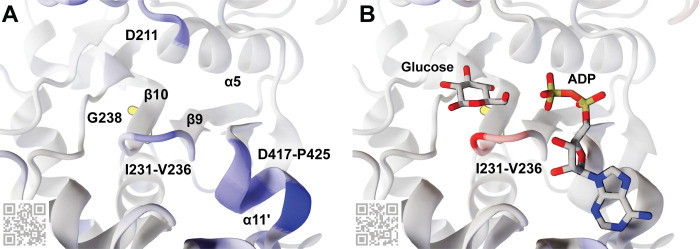
Fig 6. An Hxk2 pocket conformation taken from the MD simulations.
G238, though largely obscured by the β10 strand, is shown in yellow sticks. Other key amino acids, molecules, and secondary-structure elements are labeled. The Hxk2 protein (ribbon) is colored according to the calculated ΔRMSF values, where blue indicates that the G238V simulation was more flexible (ΔRMSF > = 0.85 Å), and red indicates that the WT simulation was more flexible (ΔRMSF < = -0.85 Å). (A) The ΔRMSF values for the apo (ligand-absent) simulations. (B) The ΔRMSF values for the holo (glucose-bound) simulations. Glucose and ADP crystallographic poses are superimposed only for reference, to indicate the locations of the glucose and ATP-binding pockets. They were taken from structures of HsHK1 (human, PDB 4FPB) and OsHXK6 (rice, PDB 6JJ8), respectively. QR codes encode ProteinVR URLs for visualization in stereoscopic 3D (virtual reality). See also Tables A and B in S1 Text.

