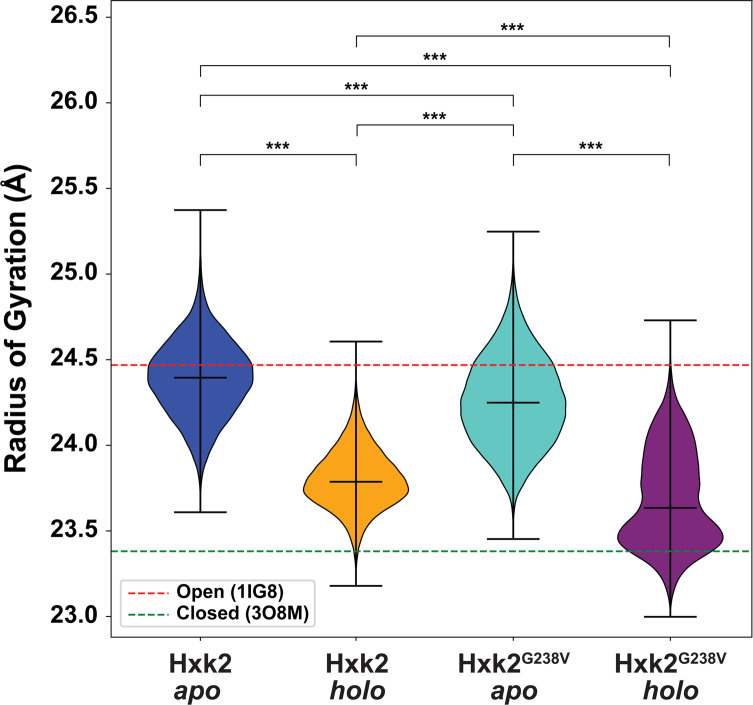
Fig 8. Distributions of the radii of gyration.
For reference, the red and green dashed lines show the corresponding values of the 1IG8 (ScHxk2, open) and 3O8M (KlHxk1, closed) crystal structures, respectively. The middle horizontal lines correspond to the median values associated with each simulation. The mean of each simulation differs statistically from the means of all others (Kruskal–Wallis, p-value < 0.001; Conover post hoc analysis, adjusted p-value < 0.001 in all cases, indicated by ***).

