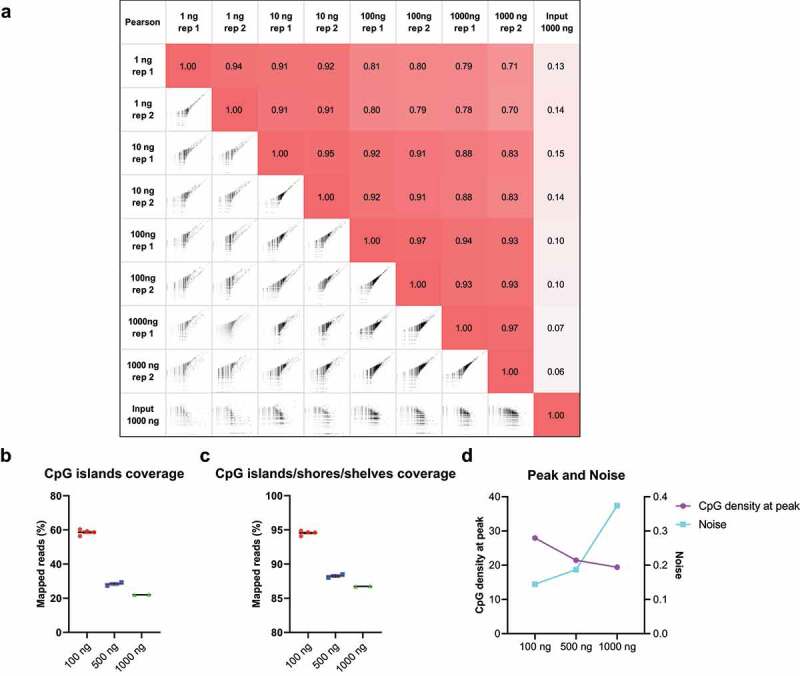
Figure 3.

Different input DNA amounts in cfMBD-seq.
(a) Genome-wide Pearson correlations of normalized read counts between cfMBD-seq signal for 1–1000 ng of input HCT116 DNA (2 technical replicates per concentration). The input control is from an input library of a ChIP-seq study (ENCODE: ENCFF280GWX). Log transformed counts were used in the scatter plots. (b,c) Total normalized CpG islands coverage and CpG islands/shores/shelves coverage across different mixtures of cfDNA and filler DNA. (N = 4 for the first condition, N = 2 for other conditions. Mean with SEM.) (d) CpG density at peak (left y-axis) and noise (right y-axis) of different mixtures of cfDNA and filler DNA.
