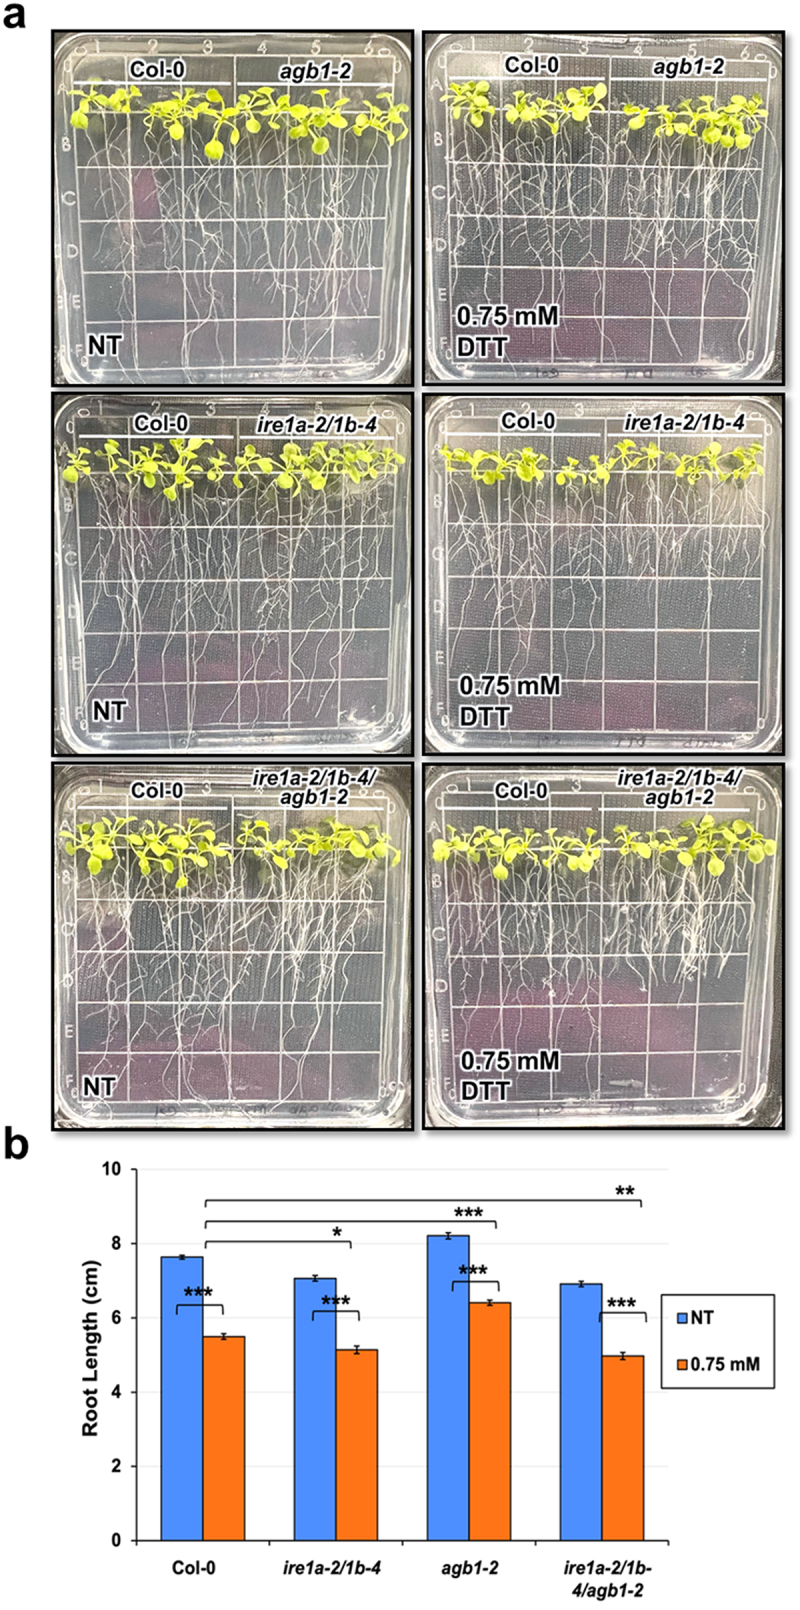
Figure 4.

Analysis of root length in response to a chemical ER stress triggered by exposure to 0.75 mM DTT of indicated genotypes. Seedlings were grown vertically on solid MS media for 7 days, then transferred to fresh plates containing solid MS media without (NT = no treatment) or with DTT. After 7 days, the seedlings were photographed (a) and root length was measured using a ruler (b). An average of 15 seedlings was used per biological replication and at least four biological replications were performed. Statistical analyses were performed by two-tailed Student’s t-test or one-way ANOVA in Excel. Error bars show mean ± SD (n ≥ 30). Significant differences are indicated by asterisks (*** p < .001, ** p < .01, * p < .05). Short solid bars connecting bars represent the comparison of root length between untreated and treated samples for each genotype, while long solid lines represent the comparison of root length of DTT-treated plants between Col-0 and an indicated mutant genotype.
