Figure 1.

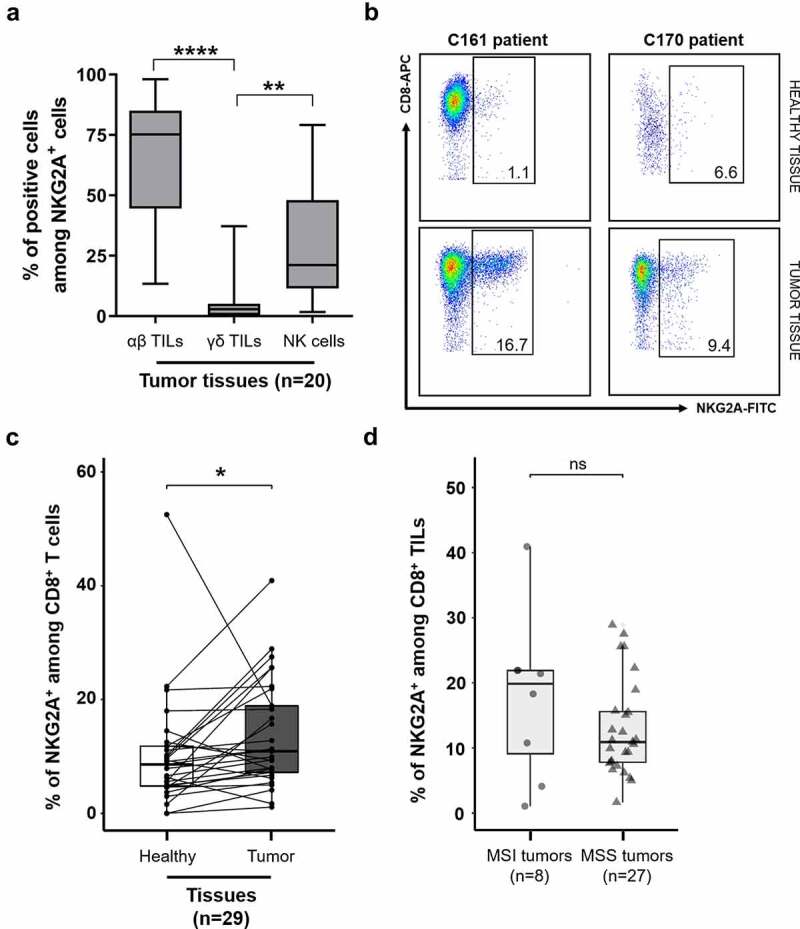
Ex vivo expression of NKG2A is highest on CD8 αβ T cells infiltrating colorectal tumors, regardless of MSS/MSI status. (a) Distribution of viable NKG2A+ lymphoid cells among αβ T cells (CD3+TCRαβ+ cells), γδ T cells (CD3+TCRγδ+ cells), and NK cells (CD3−CD56+) in 20 colorectal tumors; Friedman’s test, followed by Dunn’s multiple comparisons test. (b) Representative density plots of NKG2A expression on CD3+CD8+ T cells in healthy tissues (1.1 and 6.6%, top) and tumor tissues (16.7 and 9.4%, bottom), respectively from C161 and C170 patients. (c) Paired frequencies of NKG2A+ cells among CD8 T cells in paired tumor and normal tissues (n = 29); Wilcoxon paired t test. (d) Frequencies of NKG2A+ cells among CD8+ TILs according to MSS/MSI status (n = 35); Mann–Whitney test.
