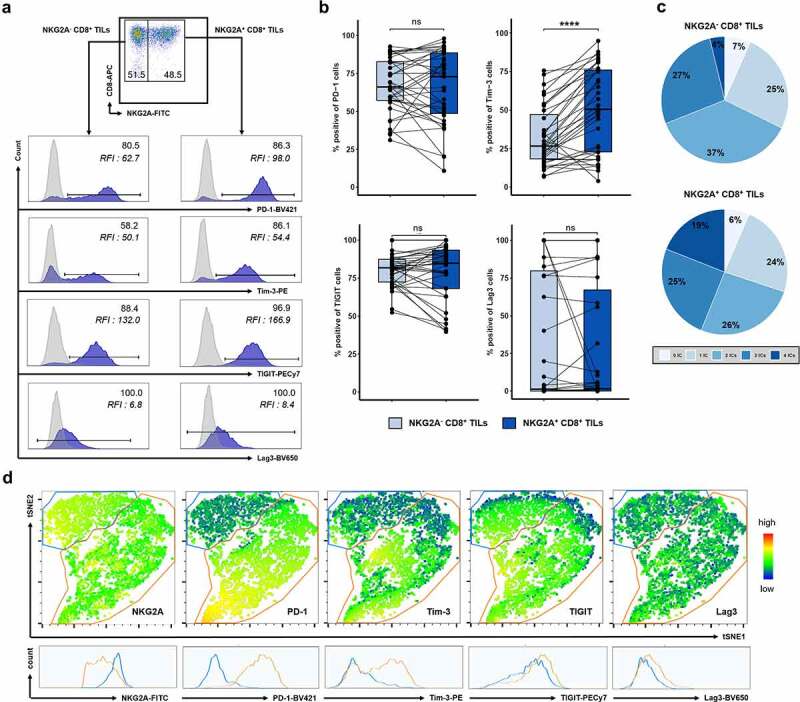
Figure 3.

NKG2A+CD8+ TILs co-express other ICs at different levels highlighting two distinct subsets. (a) Representative histograms showing the expression of PD-1, Tim-3, TIGIT, or Lag3 on NKG2A− (left panels) and on NKG2A+ (right panels) CD8+ TILs from C169 patient. Results were expressed as positive cells and Relative Fluorescence Intensity (RFI) defined as the ratio of specific fluorescence (median fluorescence of cells incubated with specific Abs) over non-specific fluorescence (median fluorescence of cells incubated with isotypic controls). (b) Paired frequencies (n = 35) of NKG2A− (light blue) and NKG2A+ (dark blue) CD8+ TILs expressing PD-1, Tim-3, TIGIT, or Lag3; Wilcoxon paired t test. (c) Pie chart analysis of the co-expression of the 4 ICs on NKG2A− and NKG2A+ CD8+ TILs. (d) Density tSNE plots from FlowJo software on pre-gated viable CD3+ CD8+ NKG2A+ TILs after concatenation of all analyzed tissue samples (n = 9). The two clusters identified on the basis of the differential expression of NKG2A are encircled in blue (higher expression) and orange (lower expression). The expression level of the 5 ICs for each cluster is represented below by histograms.
