Figure 5.

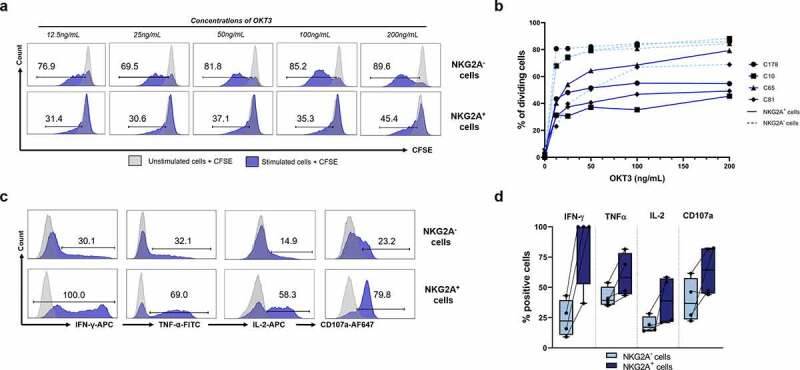
NKG2A+CD8+ TILs have better functional capacity than NKG2A−CD8+ TILs despite reduced proliferative potential. (a) Representative histograms of proliferation (CFSE assay) of NKG2A− (up) and NKG2A+ (down) CD8+ TILs from C10 patient after a 5-day culture in the presence of OKT3 mAb (from 0 to 200 ng/mL). (b) Proportion of proliferative NKG2A− (dashed light blue lines) and NKG2A+ (solid blue lines) CD8+ TILs in 4 patients, after a 5-day culture in the presence of OKT3 mAb (from 0 to 200 ng/mL). (c) Representative histograms of the percentage of NKG2A− (up) or NKG2A+ (down) CD8+ TILs from C81 patient producing IFN-γ, TNF-α, or IL-2 after a 5-hour stimulation (OKT3 mAb, 400 ng/mL) in the presence of brefeldin A (10 µg/mL) and expressing the surface degranulation marker CD107a after 3 hours in the presence of OKT3 mAb (400 ng/mL). (d) Percentage of NKG2A− (light blue) or NKG2A+ (dark blue) CD8+ TILs (n = 4) producing IFN-γ, TNF-α, IL-2 or CD107a in the same experimental conditions as (c).
