
Figure 7.
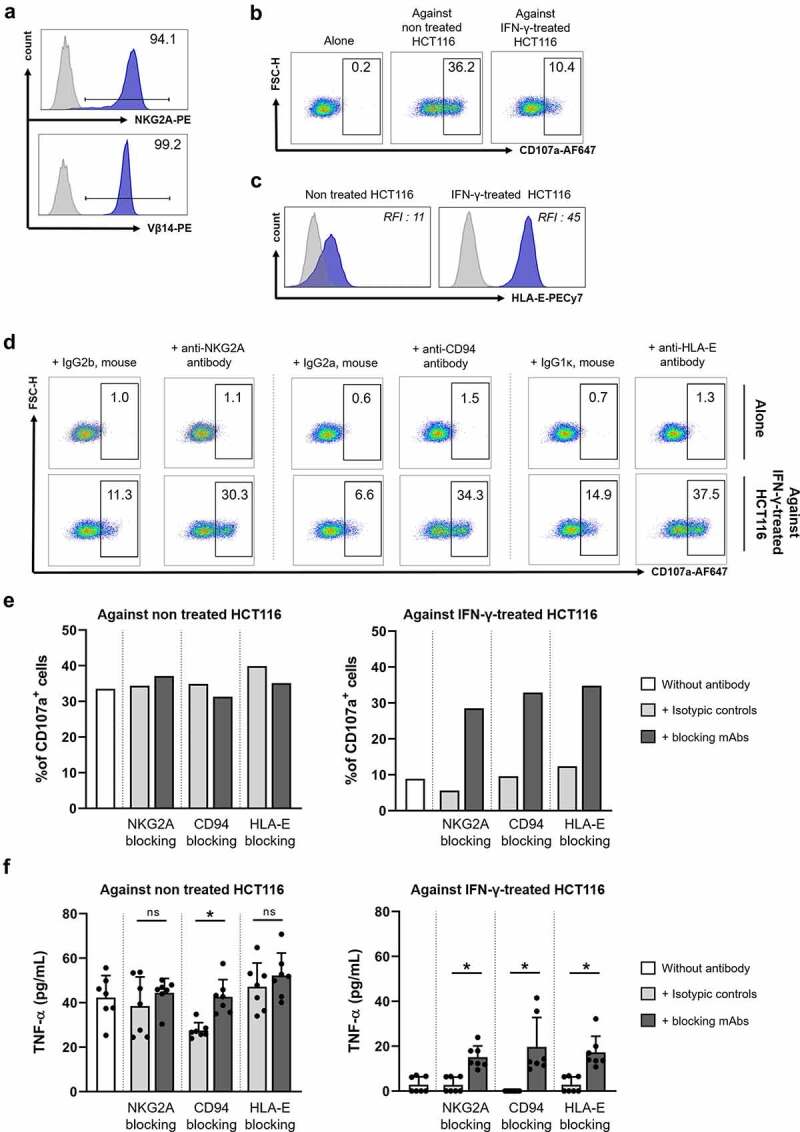
Blocking the CD94/NKG2A/HLA-E axis restores anti-tumor responses of a NKG2A+ T-cell clone. (a) Expression of NKG2A and Vβ14 by the C178-A T-cell clone. (b) Density plots showing the C178-A T-cell clone cytotoxic response (degranulation marker CD107a) when cultured alone (left) and upon coculture with HCT116 cell line without (middle) and after (right) IFN-γ treatment (500 U/mL, 48 hours). (c) HLA-E expression on HCT116 cell line before and after IFN-γ treatment (500 U/mL, 48 hours), with isotype control in light gray. (d) Density plots showing cytotoxic responses (degranulation marker CD107a) of C178-A T-cell clone alone (top) or against HCT116 cell line (bottom) pretreated with IFN-γ (500 U/mL, 48 hours) in the presence of a blocking mAb (anti-NKG2A, anti-CD94, or anti-HLA-E) or the corresponding isotypic control (10 µg/mL). (e) Frequencies of CD107a+ cells among C178-A T-cell clone or (f) concentrations of secreted TNF-α (pg/mL) by C178-A T-cell clone after stimulation with HCT116 cell line without (left) and after (right) IFN-γ treatment (500 U/mL, 48 h) in the presence of blocking mAb or isotypic control (10 µg/mL); Wilcoxon paired t test.