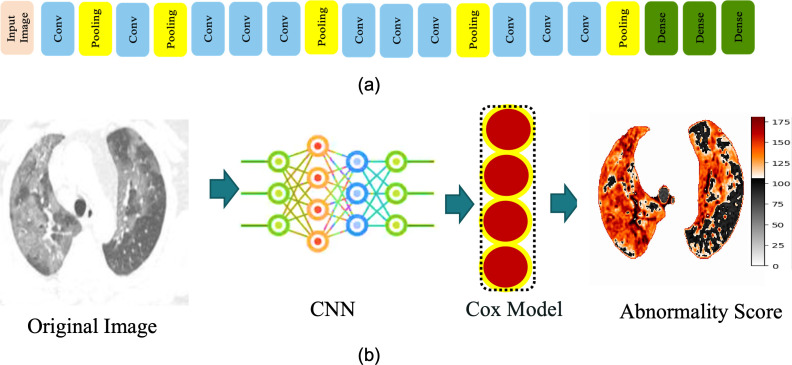
Fig 5.
(a) The architecture of the CNN for abnormality prediction. We used the segmented lungs and GGOs as input images (described in section 3.1). (b) Workflow diagram for abnormality prediction. We used the CNN architecture mentioned in Fig 5A. The output of the CNN network was fed to the Cox model to compute abnormality. The output of abnormality scores is represented by a heatmap. Orange to red color denotes high-abnormality regions.

