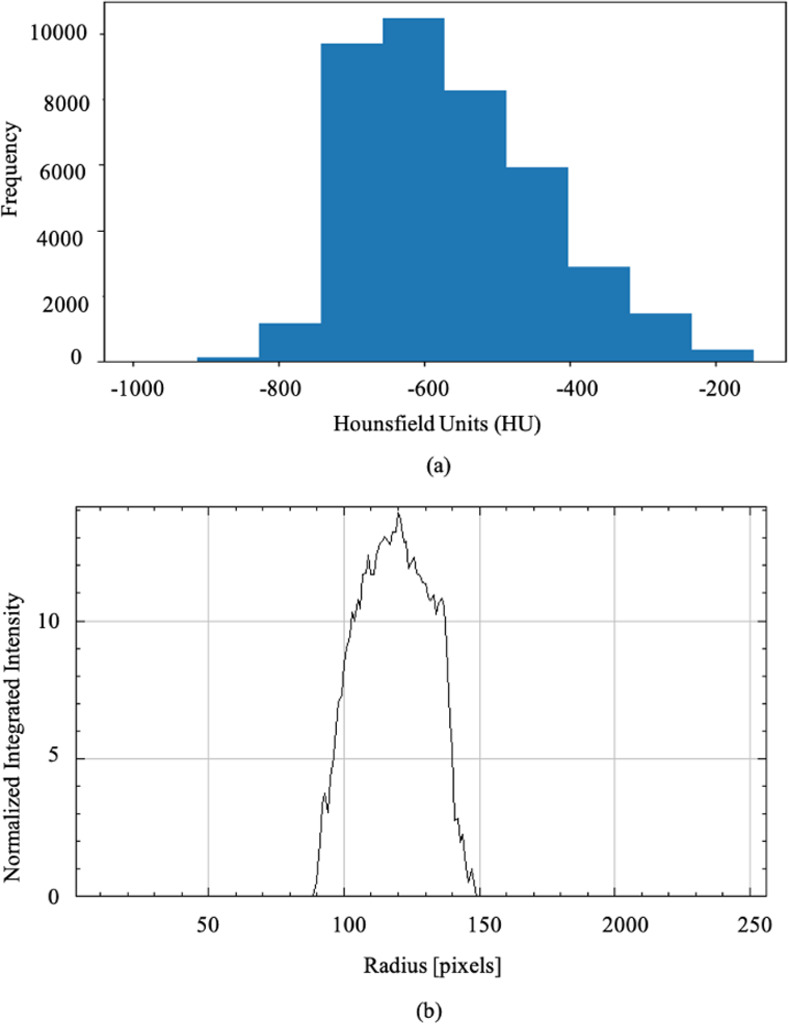
Fig 6. GGO shape analysis of COVID-19 data using Minkowski tensors.

(a) Probability distribution shows that GGOs for all the images lie between -800 and -150 HU with peaks in the distribution centered around -600 HU. (b) Radial distribution function versus distance shows a peak around 125 pixels.
