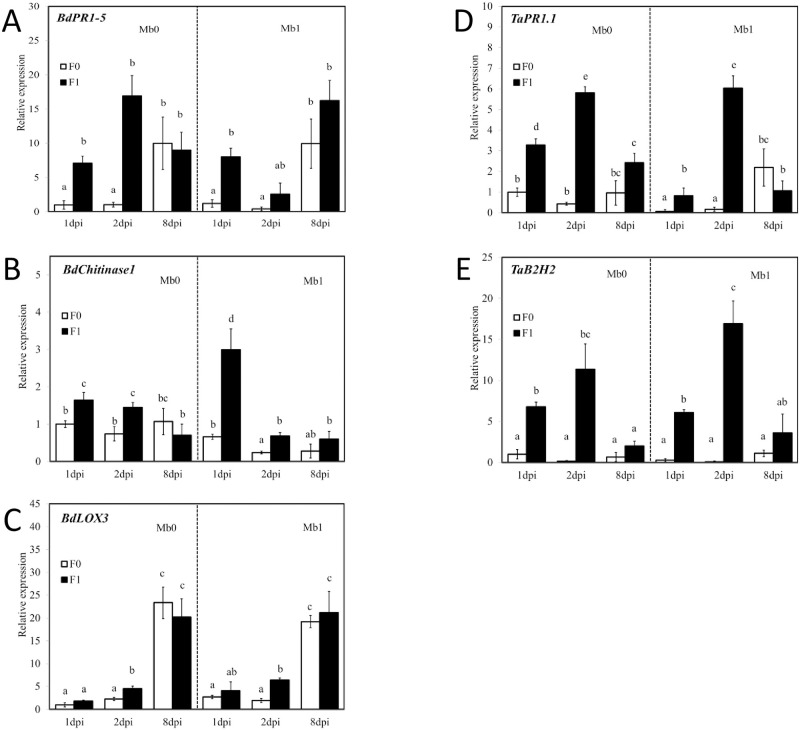
Fig 2. Expression profiles of genes BdPR1-5 (A), BdChitinase1 (B) and BdLOX3 (C) in Brachypodium distachyon (Bd) and TaPR1.1 (D) and TaB2H2 (E) in wheat inoculated with Microdochium bolleyi (Mb1) or not so inoculated (Mb0) and with leaves infected with Fusarium culmorum (F1) or not so infected (F0) at three time periods 1, 2, and 8 days post inoculation (dpi).
Expression levels are relative to M. bolleyi non-inoculated and Fc non-infected leaves of plants at 1 dpi and were normalized with the reference genes BdSamDC and TaGADPH. Expression levels shown are mean values and standard deviations (whiskers) for three replications. Statistically significant differences are indicated by letters above columns (post hoc Tukey’s test, P < 0.05).

