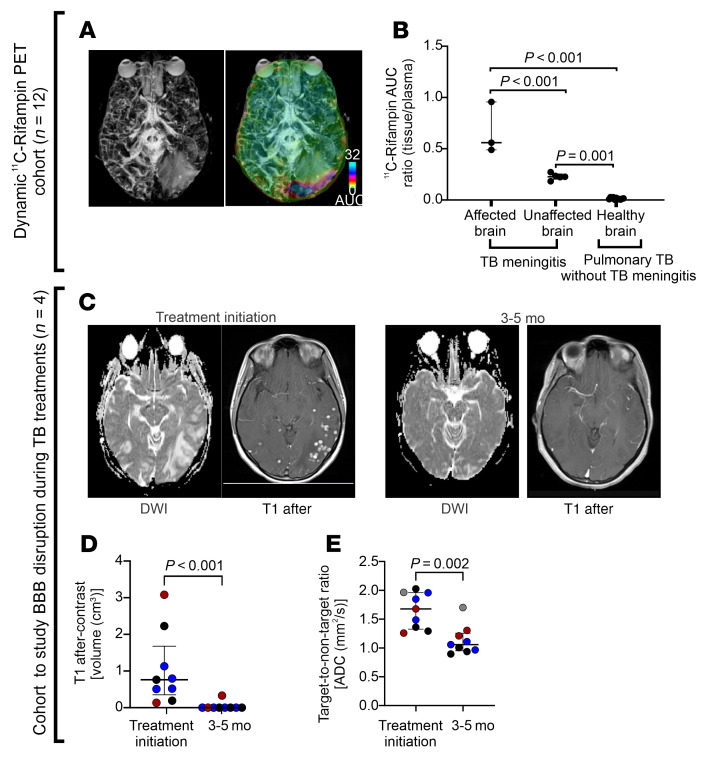
Figure 6. Imaging studies in patients with TB meningitis.
(A and B) 11C-Rifampin PET/CT to study rifampin exposures. (A) MRI T2 FLAIR maximum intensity projection (MIP) (right) with the corresponding 11C-rifampin PET AUC overlaid as a heatmap (left). (B) 11C-Rifampin brain/plasma AUC ratios in brain regions with and without vasogenic edema in a patient with TB meningitis (n = 1 patient with 7 VOI) and in brains of patients with pulmonary TB, but without meningitis (n = 11 patients, 1 VOI per patient). (C–E) Another cohort of patients with TB meningitis who underwent serial MRI during TB treatment was used to assess the blood-brain barrier disruption (n = 4 patients). (C) Representative MRI axial sections with DWI and T1 after contrast at treatment initiation (left) and after 3 months of treatment (subject 1, Supplemental Table 1). (D) Changes in brain T1 after contrast volume (cm3) during TB treatment (n = 3; no contrast was administered for subject 4 with chronic renal disease). (E) Changes in brain diffusion (ADC [mm2/s]) for all 4 patients. All patients received 2 months of initiation treatment with HRZ with or without fluoroquinolones, followed by continuation phase with at least 12 months of HR treatment. Panel C and the corresponding T2 FLAIR are shown in Supplemental Figure 18A. Data are represented as median ± IQR. Statistical comparisons were performed using 2-way ANOVA followed by Bonferroni’s multiple-comparison test (B) and 2-tailed Mann-Whitney-Wilcoxon test (D and E). TB drug treatments are abbreviated. BBB, blood-brain barrier; T1 post, T1 after contrast image.

