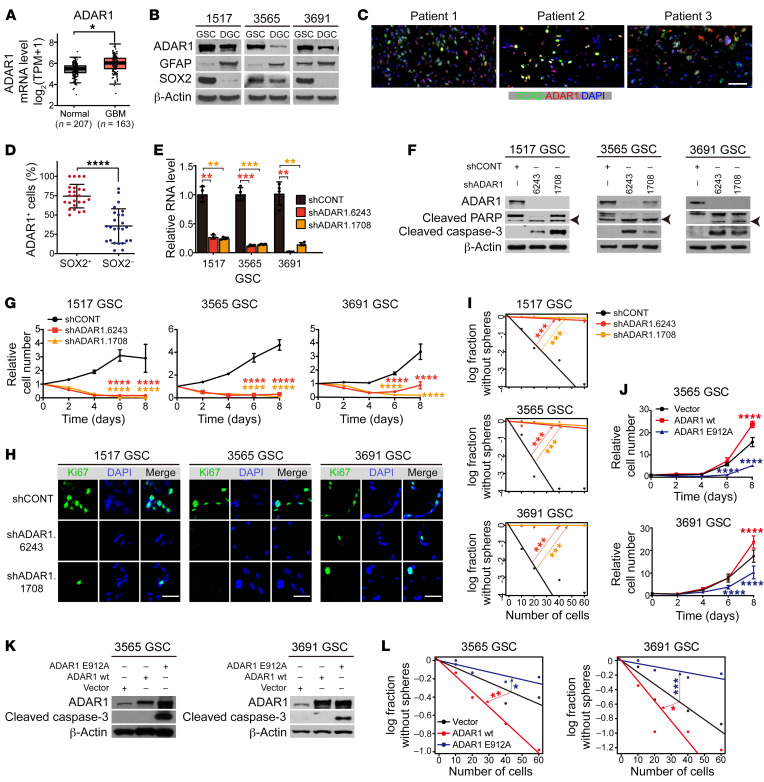
Figure 2. ADAR1 promotes GSC proliferation and self-renewal.
See also Table 1 and Supplemental Figures 2 and 3. (A) ADAR1 expression levels in GBM (TCGA) and normal brain in the Genotype-Tissue Expression (GTEx) database. *P < 0.05. TPM, transcripts per million. (B) Immunoblotting of ADAR1 in paired GSCs and DGCs. GFAP and SOX2 serve as markers of differentiated and stem/progenitor cells. β-Actin served as loading control. (C) Immunofluorescence analysis of ADAR1 and SOX2. Scale bar: 50 μm. (D) Percentage of ADAR1+ cells among SOX2+ versus SOX2– cells performed in C. Data were compared by Student’s t test and shown as mean ± SD. ****P < 0.0001. (E) ADAR1 expression of GSCs transduced with shCONT or shADAR1. n = 4. Data was determined by ANOVA and shown as mean ± SD. **P < 0.01, ***P < 0.001. (F) Immunoblotting for ADAR1, PARP, and cleaved caspase-3 in GSCs transduced with shCONT or shADAR1. β-Actin served as loading control. Arrowheads indicate cleaved PARP. (G) Proliferation of GSCs transduced with shCONT or shADAR1. Data was determined by 2-way ANOVA with Dunnett’s multiple-comparison testand shown as mean ± SD. n = 5. ****P < 0.0001. (H) Immunofluorescence analysis of Ki67 of GSCs transduced with shCONT or shADAR1. Scale bars: 20 μm. (I) Extreme limiting dilution analysis (ELDA) for sphere formation of GSCs transduced with shCONT or shADAR1. Data was determined by pairwise tests. n = 24. ***P < 0.001. (J) Proliferation of GSCs transduced with vector, ADAR1 wt, or ADAR1 E912A. Data was determined as in G. n = 5. ****P < 0.0001. (K) Immunoblotting for ADAR1 and cleaved caspase-3 in GSCs transduced as in J. β-Actin served as loading control. (L) ELDA for sphere formation of GSCs transduced as in J. n = 24. *P < 0.05, **P < 0.01, ***P < 0.001.

