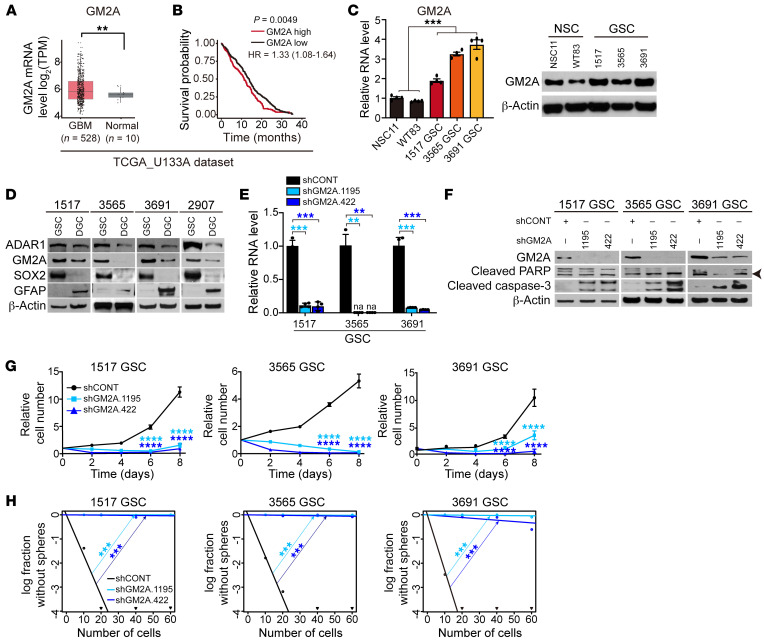
Figure 4. GM2A maintains GSC survival, proliferation, and self-renewal.
See also Table 2. (A) Gene expression levels of GM2A in normal brain or gliomas in the TCGA database. Statistical significance was determined by Wilcoxon’s signed-rank test. **P < 0.01. (B) Kaplan-Meier survival curves of glioma patients with high or low GM2A expression in TCGA. P value was determined by log-rank test. (C) Left: Comparative GM2A mRNA expression in NSCs (NSC11 and WT83) and GSCs (1517, 3565, and 3691) by reverse transcriptase PCR. n = 4. Statistical significance was determined by ANOVA. ***P < 0.001. Right: Western blotting for GM2A in NSCs (NSC11 and WT83) and GSCs (1517, 3565, and 3691). β-Actin served as loading control. (D) Western blotting for ADAR1 and GM2A in matched GSCs and DGCs. GFAP and SOX2 served as markers of differentiated or stem/progenitor cells. β-Actin served as loading control. (E) GM2A mRNA expression in GSCs (1517, 3565, and 3691) transduced with shCONT or shGM2A. na, not available. n = 4. Quantitative data from 4 independent experiments are shown as mean ± SD (error bars). Statistical significance was determined by ANOVA. **P < 0.01, ***P < 0.001. (F) Western blotting for GM2A, PARP, and cleaved caspase-3 in GSCs (1517, 3565, and 3691) transduced with shCONT or shGM2A. β-Actin served as loading control. Arrowhead indicates cleaved PARP. (G) Proliferation of GSCs (1517, 3565, and 3691) transduced with shCONT or shGM2A as determined by CellTiter-Glo. Quantitative data from 5 technical experiments are shown as mean ± SD (error bars). n = 5. Statistical significance was determined by 2-way ANOVA with Dunnett’s multiple-comparison test. ****P < 0.0001. (H) ELDA for in vitro sphere formation of GSCs (1517, 3565, and 3691) transduced with shCONT or shGM2A. n = 24. Pairwise tests for differences in stem cell frequencies. ***P < 0.001.

