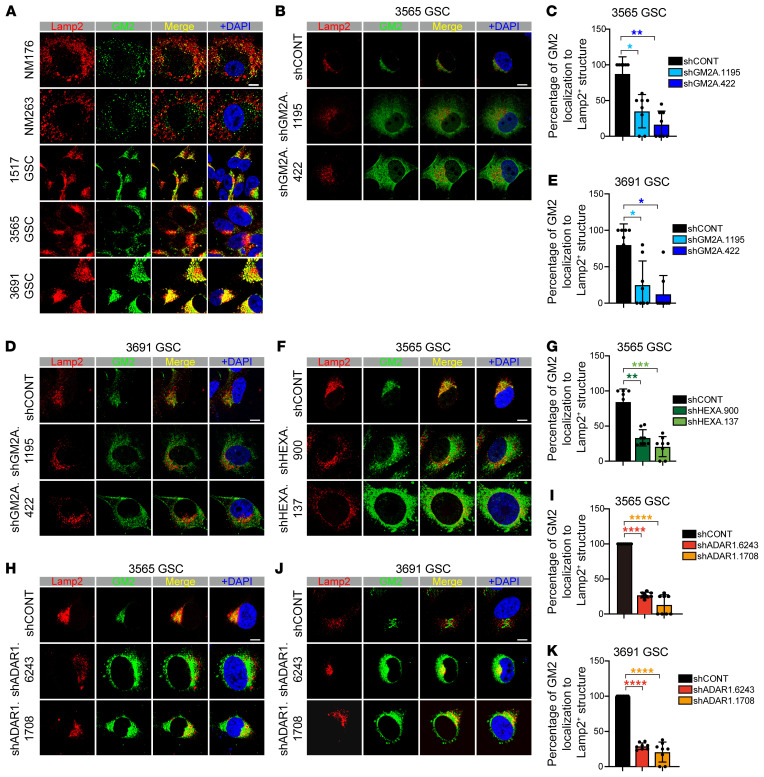
Figure 6. Disruption of GM2 ganglioside catabolism relocates GM2 gangliosides.
(A) Immunofluorescence analysis of nonmalignant cells derived from epilepsy surgical specimens (NM176 and NM263) and GSCs (1517, 3565, and 3691) with lysosome marker Lamp2 and GM2 ganglioside. DAPI indicates nuclei. Scale bar: 10 μm. (B) Immunofluorescence analysis of 3565 GSCs transduced with shCONT or shGM2A with lysosome marker Lamp2 and GM2 ganglioside. n = 2 biological replicates. DAPI indicates nuclei. Scale bar: 10 μm. (C) Statistical values for experiments performed in B. Data are shown as mean ± SD. Statistical significance was compared by Student’s t test. *P < 0.05, **P < 0.01. (D) Immunofluorescence analysis of 3691 GSCs transduced with shCONT or shGM2A with lysosome marker Lamp2 and GM2 ganglioside. n = 2 biological replicates. DAPI indicates nuclei. Scale bar: 10 μm. (E) Statistical values for experiments performed in D. Data are shown as mean ± SD. Statistical significance was compared by Student’s t test. *P < 0.05. (F) Immunofluorescence analysis of 3565 GSCs transduced with shCONT or shHEXA with lysosome marker Lamp2 and GM2 ganglioside. n = 2 biological replicates. DAPI indicates nuclei. Scale bar: 10 μm. (G) Statistical values for experiments performed in F. Data are shown as mean ± SD. Statistical significance was compared by Student’s t test. **P < 0.01, ***P < 0.001. (H) Immunofluorescence analysis of 3565 GSCs transduced with shCONT or shADAR1 with lysosome marker Lamp2 and GM2 ganglioside. n = 2 biological replicates. DAPI indicates nuclei. Scale bar: 10 μm. (I) Statistical values for experiments performed in H. Data are shown as mean ± SD. Statistical significance was compared by Student’s t test. ****P < 0.0001. (J) Immunofluorescence analysis of 3691 GSCs transduced with shCONT or shADAR1 with lysosome marker Lamp2 and GM2 ganglioside. n = 2 biological replicates. DAPI indicates nuclei. Scale bar: 10 μm. (K) Statistical values for experiments performed in J. Data are shown as mean ± SD. Statistical significance was compared by Student’s t test. ****P < 0.0001.

