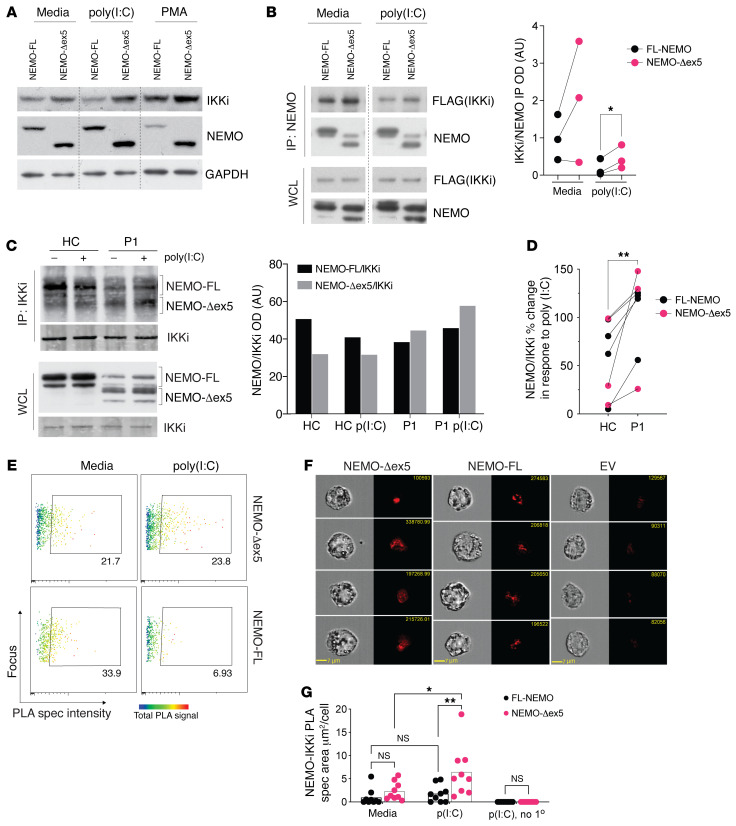
Figure 4. NEMO-Δex5 and IKKi form a stable complex in response to poly(I:C) stimulation.
(A) THP1 cells reconstituted with FL and mutant NEMO forms and stimulated with poly(I:C) for 90 minutes or differentiated with PMA for 72 hours followed by Western blot of whole cell lysates. (B) HEK293T cells were transfected with FL or NEMO-Δex5 followed by stimulation with poly(I:C) 10 μg/mL for 8 hours and IP of IKKi using FLAG epitope. The membrane was probed for IKKi and NEMO with quantitation of pulled down IKKi normalized to NEMO on the right; means compared by paired, 2-tailed t test. (C) HC and P1 blasting T cells stimulated with poly(I:C) 10 μg/mL for 3 hours and IKKi isolated by IP. Western blot to detect co-immunoprecipitated NEMO, and IKKi blot as IP control, (right) quantitation of NEMO pulldown with IKKi by densitometry, black bars correspond to FL-NEMO bands and gray bars to NEMO-Δex5 forms in top panel (ImageJ). (D) Quantitation of total NEMO pulldown (NEMO-FL + NEMO-Δex5) as in C, shown as poly(I:C) response [ratio of poly(I:C) treated/media] (n = 4 independent IPs from NDAS-P1 and 4 IPs from HC T cells; means compared by paired, 2-tailed t test. Lines link paired data obtained from the same experiment. (E) NEMO-reconstituted THP1 cells in media or stimulated with LMW poly(I:C) 10 μg/mL for 60 minutes with NEMO and IKKi proximity ligation assay (PLA) spec intensity (x axis) and total NEMO/IKKi complex intensity (rainbow heatmap) using specific antibodies against IKKi and NEMO. (F) Four representative images taken at 40× original magnification of cells treated for 60 minutes as in E, with average signal area quantified; means compared by 2-way ANOVA with Tukey’s correction (G). EV, empty vector; FL, full length; no 1°, omission of primary antibody control. All results representative of at least 2 independent experiments. *P < 0.05; **P < 0.01.

