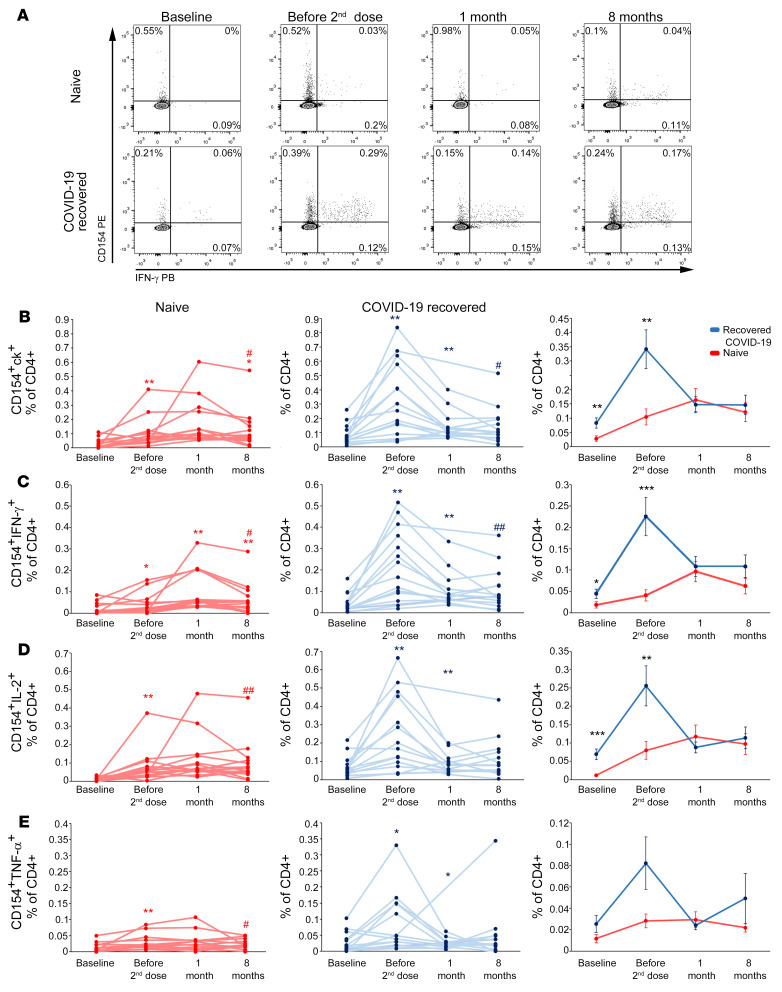
Figure 4. Longitudinal evaluation of spike-specific circulating T cells in naive individuals and individuals who have recovered from COVID-19.
(A) Representative flow cytometric plots of spike-specific CD4+CD154+IFN-γ+ T cells in 1 naive individual (top) and 1 individual who has recovered from COVID-19 (bottom) before vaccination, before second injection, and after 1 and 8 months following the complete vaccination cycle. Longitudinal evaluation of frequencies of spike-specific T cells expressing CD154 and producing at least 1 cytokine (ck) among IL-2, IFN-γ, and TNF-α (B), CD154+IFN-γ+ (C), CD154+IL-2+ (D), and CD154+TNF-α+ (E) in naive individuals (red lines, left) and individuals who have recovered from COVID-19 (blue lines, middle). Cumulative data are represented (right) as mean ± SEM from 15 naive individuals and 15 individuals who have recovered from COVID-19. In B–E, data are shown after subtraction of the background, unstimulated condition. Red and blue asterisks (left and middle) refer to paired statistics within each study group compared with the previous time point in the kinetics calculated with Wilcoxon’s signed-rank test. Red and blue pound signs (left and middle) refer to paired statistics within each study group between baseline and 8 months, calculated with Wilcoxon’s signed-rank test. Black asterisks (right) represent unpaired statistics between naive individuals and individuals who have recovered from COVID-19 at each time point calculated with Mann-Whitney test. *P < 0.05; #P < 0.05; **P < 0.01; ##P < 0.01; ***P < 0.001.

