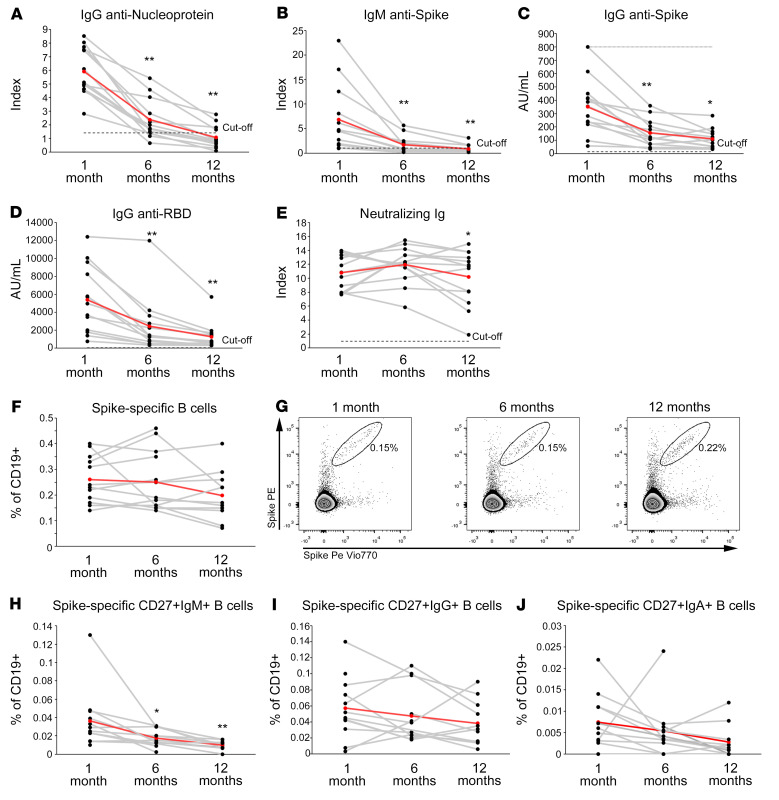
Figure 7. Longitudinal evaluation of SARS-CoV-2–specific antibody levels up to 1 year following infection.
Levels of anti-nucleoprotein IgG (A), anti-spike IgM (B), anti-spike IgG (C), anti-RBD IgG (D), and neutralizing Ig (E) in 13 individuals who have recovered from COVID-19 evaluated 1, 6, and 12 months following hospital discharge. Frequencies of total (F), CD27+IgM+ (H), CD27+IgG+ (I), CD27+IgA+ (J) spike-specific B cells evaluated at 1, 6, and 12 months following hospital discharge in 14 individuals who have recovered from COVID-19. Representative FACS plots of total spike-specific B cells at each time point are shown in G. Red lines represent mean values. Asterisks refer to paired statistics at each time point compared with the previous, calculated with Wilcoxon’s signed-rank test. *P < 0.05; **P < 0.01.

