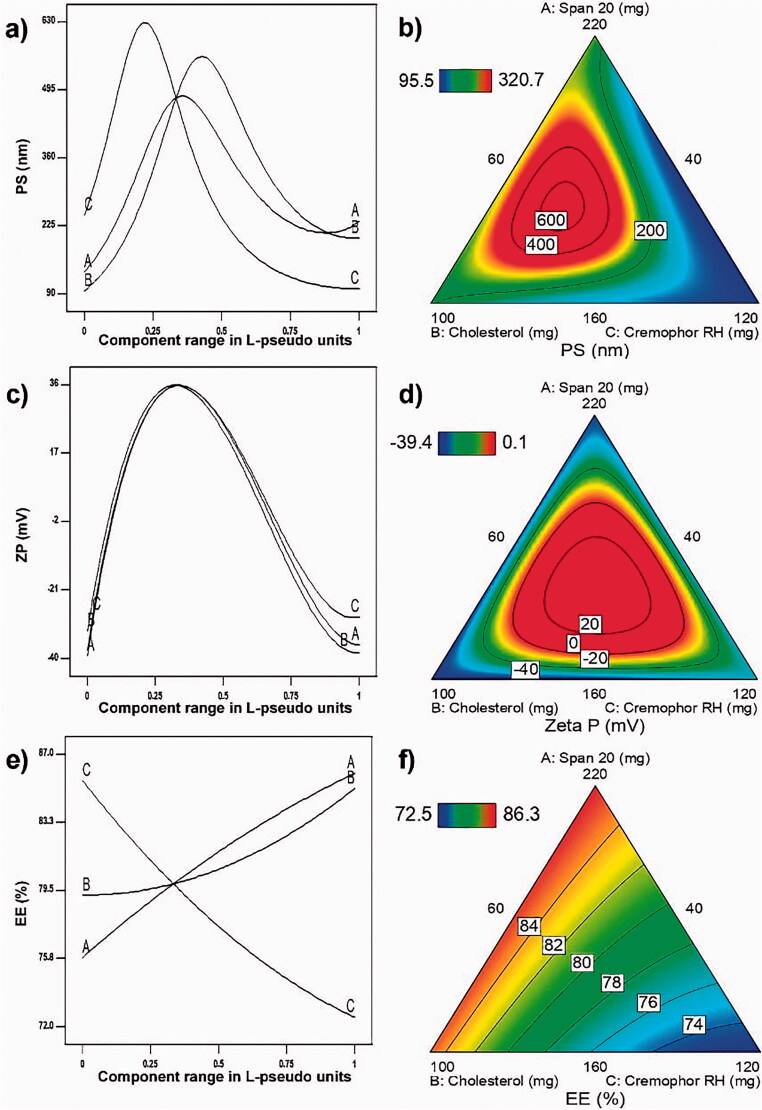
Figure 2.
Piepel’s response trace plots – for (a) particle size, (c) zeta potential and (e) entrapment efficiency – upon changing each MixC L-pseudo value over its range keeping the ratio of the other two components constant (1:1). Contour plots showing lines of equal responses for: (b) particle size, (d) zeta potential, and (f) entrapment efficiency over the constrained mixture region.

