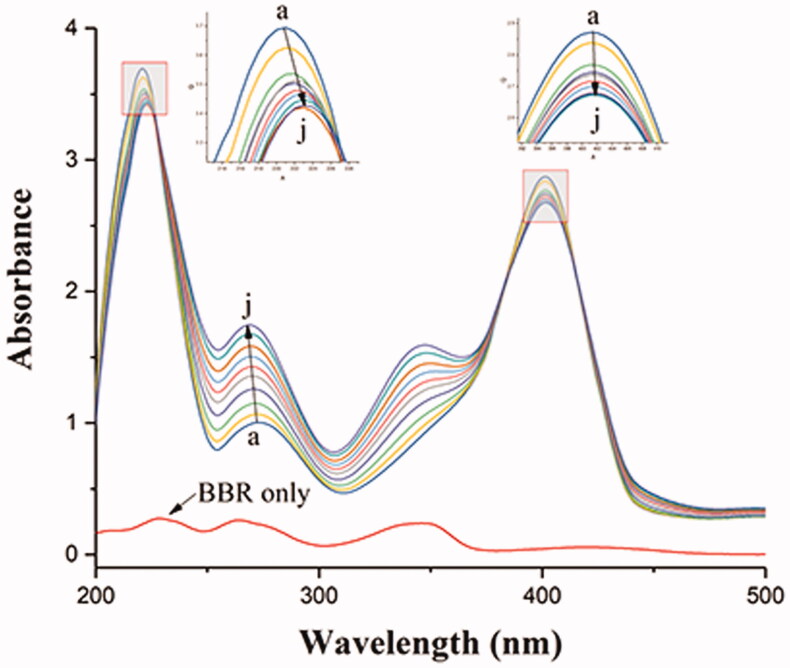
Figure 7.
Absorption spectral titration of BHB (curve a) with increasing amounts of BBR (curves b–j). Conditions: BHB: 1 × 10⁻⁵ mol/L; BBR/(10−5 mol/L): (a) 0, (b) 0.2, (c) 0.4, (d) 0.6, (e) 0.8, (f) 1.0, (g) 1.2, (h) 1.4, (a) 1.6 and (j) 1.8. The concentration of BBR alone is 1.0 × 10⁻⁵ mol/L; pH = 7.4 and T = 298 K.

