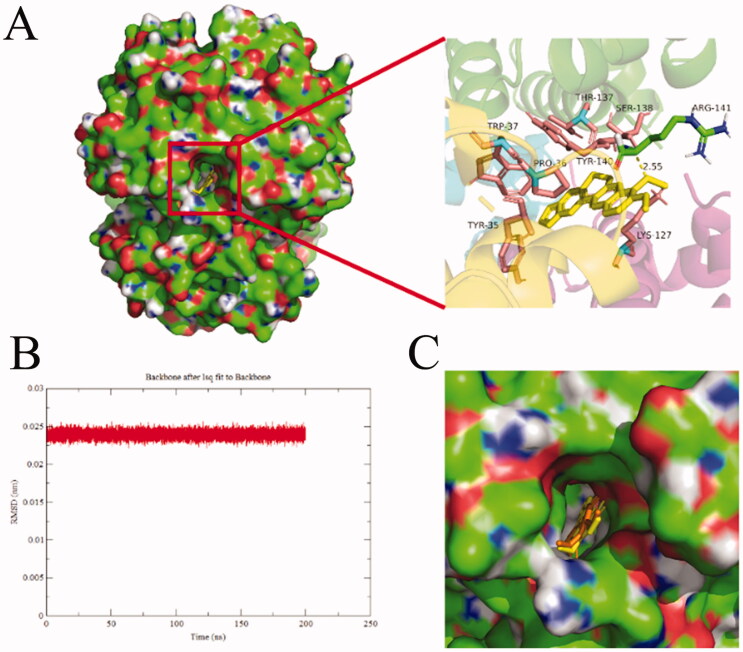
Figure 11.
Docking conformations of BBR (A) in complex with BHB. (B) The rmsd value of BBR-BHB complex, (C) The protein-ligand conformation before (color: yellow) and after (color: orange) MD simulation. BBR was displayed in balls and sticks, yellow dotted lines indicated hydrogen bond (PDB ID: 1G09).

