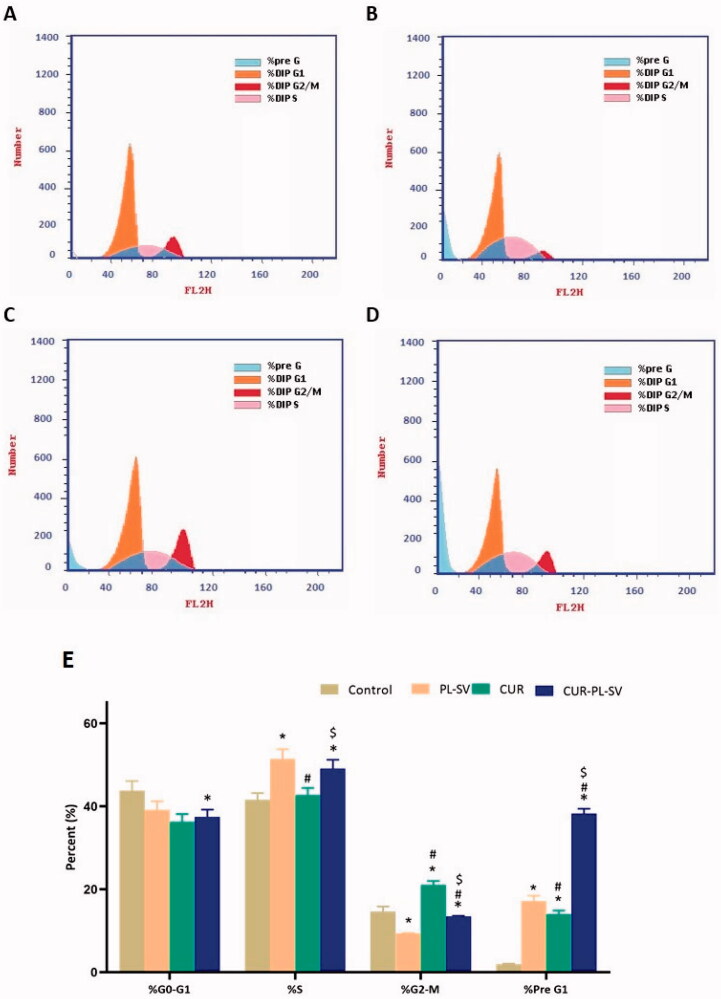
Figure 5.
Cell cycle analysis by flow cytometry. (A) Untreated Control, (B) PL-SV, (C) CUR, (D) CUR–PL–SV, and (E) bar diagram of the different cycle phases. Data are the mean of four independent experiments ± SD. *Significantly different vs. control, p<.05; #significantly different vs. PL-VS, p<.05; $significantly different vs. CUR. CUR: curcumin; PL: Phospholipon® 90H; SV: scorpion venom peptide.

