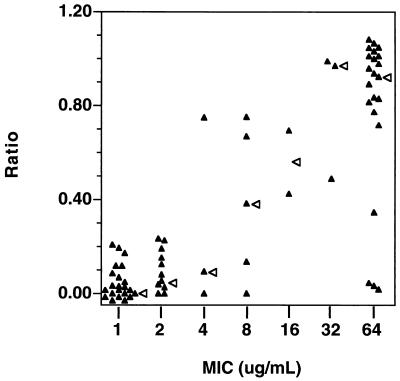
FIG. 3.
Hyphal formation in a random sample from a population of clinical isolates in the absence or presence of fluconazole. A collection of randomly selected isolates was tested for hyphal formation in the absence and presence of fluconazole at 10 μg/ml. The ratio (percent hyphal formation in the presence of fluconazole/percent hyphal formation in the absence of fluconazole) was graphed versus the MICs for the isolates. Each filled triangle represents the data for a separate clinical isolate. The absolute values on both the x and y axes have been slightly modified for the graph so that all the datum points are distinct. An open arrowhead to the right of the value marks the median value. A positive correlation was observed between the ratio of hyphal formation (y axis) and the MIC (x axis)(R = 0.757; P < 0.0001). Percent hyphal formation was observed at 3 h. Cells were grown in YAD and were induced in M199.

