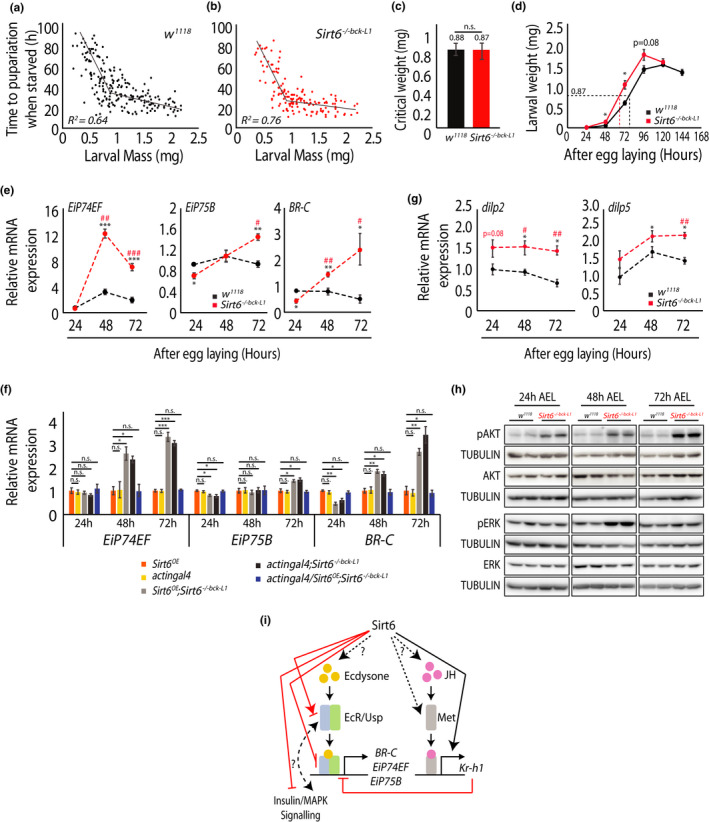
FIGURE 2.

Sirt6 absence accelerates larval development with no change in critical weight. (a, b) Time to pupariation in w1118 (a) and Sirt6−/−bck−L1 (b) larvae starved at different weights. The break in regression line indicates the time when critical weight has been reached (N = 3, n = 250–300). (c) Critical weight computed from (a, b) for w1118 and Sirt6−/−bck−L1 larvae. (d) Larval weight gain in w1118 and Sirt6−/−bck−L1 post‐synchronised egg laying. Mutant Sirt6 larvae reach critical weight earlier than controls. (N = 3, n = 20–25 per genotype). (e, f) Relative change in expression of ecdysone target genes in Sirt6−/−bck−L1 larvae compared to w1118 during the course of larval development (e) and their rescue with transgenic Sirt6 expression (f), as indicted (N = 3, n = 3 with 10–20 larvae per n). Asterisk depicts comparison with w1118 at 24 h and hashtags depict comparison of the Sirt6−/−bck−L1 to w1118 , at the respective time points, as indicated. (g) Relative change in expression of dilp2 and dilp5 in Sirt6−/−bck−L1 larvae compared to w1118 during the course of larval development (N = 3, n = 3 with 10–20 larvae per n). Asterisk depicts comparison with w1118 at 24 h and hashtags depict comparison of the Sirt6−/−bck−L1 to w1118 , at the respective time points, as indicated. (H) Representative western blots showing phosphorylation of AKT and ERK at 24, 48 and 72 h post‐egg laying in control w1118 and Sirt6−/−bck−L1 larvae. (i) Schematic depicting Sirt6‐mediated regulation of ecdysone and insulin signalling. All data presented are mean ± SEM. Asterisk and hashtags depict p values (*, # p < 0.05, **, ## p < 0.01 and ***, ### p < 0.001) as observed by Student's t‐test and two‐way ANOVA, wherever applicable
