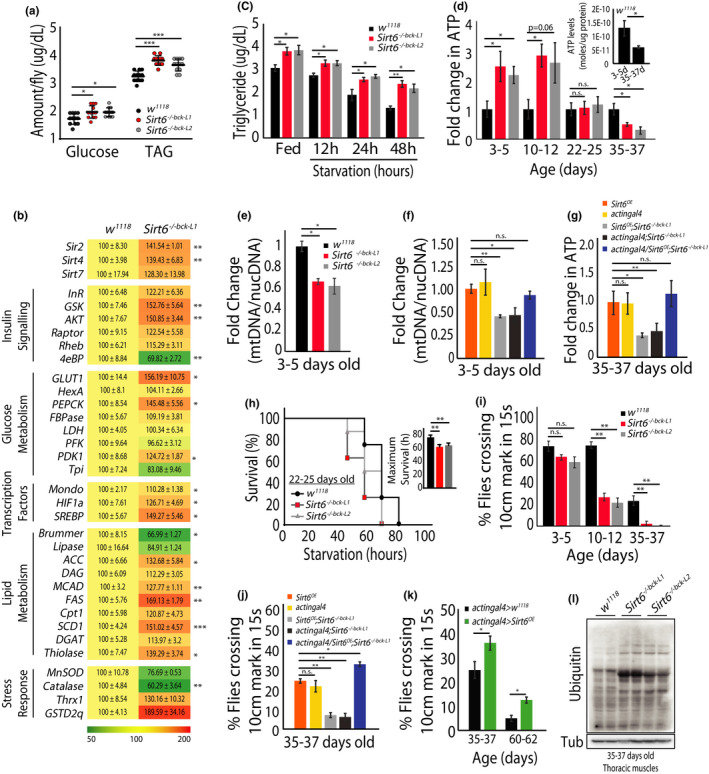
FIGURE 3.

Adult Drosophila Sirt6 mutants display ageing‐associated physiological deficits. (a) Total glucose and TAG levels in 3–5 day old w1118 and Sirt6−/−bck−L1/L2 flies (N = 3, n = 10 with 8 flies per n). (b) Real‐time PCR analysis of gene expression in 3–5 day old w1118 and Sirt6−/−bck−L1/L2 flies (N = 2, n = 3 with 8 flies per n). (c) Relative whole body TAG levels at fed and starved (12, 24 and 48 h) in 3–5 day old w1118 (control) and Sirt6−/−bck−L1/L2 flies (N = 2, n = 4 with 8 flies per n). (d) Whole body ATP levels across ages in w1118 and Sirt6−/−bck−L1/L2 flies. Inset depicts age‐associated change in total ATP levels in w1118 flies (N = 3, n = 6 with 10 flies per n). (e) Mitochondrial DNA content (normalised to nuclear DNA) in 3–5 days old w1118 and Sirt6−/−bck−L1/L2 flies (N = 2, n = 3 with 30 flies per n). (f) Mitochondrial DNA content (normalised to nuclear DNA) in 3–5 days old flies, as per indicated genotypes. (N = 2, n = 3 with 30 flies per n). (g) Whole body ATP levels in 35–37 days old flies, as per indicated genotypes (N = 2, n = 3 with 30 flies per n). (h) Starvation survival in 22–25 day old w1118 and Sirt6−/−bck−L1/L2 flies (N = 3, n = 6 with 10 flies per n). (i) Percentage of w1118 and Sirt6−/−bck−L1/L2 flies crossing the 10 cm mark in 15 s, across ages, as indicated. (N = 4, n = 80–100). (j) Rescue of physical activity by transgenic expression of Sirt6 in old Sirt6−/−bck−L1/L2 flies (N = 4, n = 80–100). (k) Assessment of physical activity in 35–37 and 60–62 day old flies overexpressing Sirt6 on a wild‐type background (N = 4, n = 80–100). (l) Representative immunoblot of total ubiquitinated proteins in 35–37 day old thoracic muscles of w1118 and Sirt6−/−bck−L1 / L2 . All data presented are mean ±s.e.m. Asterisk depicts p values (*p < 0.05, **p < 0.01 and ***p < 0.001) as observed by Student's t‐test or two‐way ANOVA, as applicable
