
FIGURE 5.
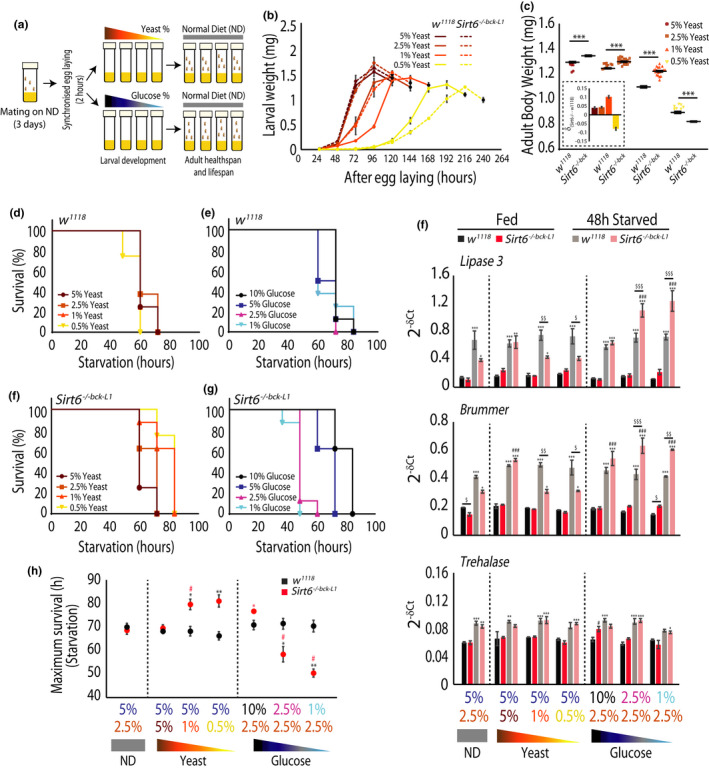
Sirt6 is essential for coupling developmental nutrient availability to adult fitness. (a) Schematic of experimental paradigm used for larval diet perturbation with varying concentrations of yeast and glucose, as indicated. (b) Weight gain and pupation onset (marked in black) in w1118 (control) and Sirt6−/−bck−L1 larvae reared on differential yeast concentrations, as indicated. (N = 3, n = 20–25). (C) Body weight measurements in 3–5 day old w1118 and Sirt6−/−bck−L1 flies (N = 3, n = 20–25 per genotype). Inset depicts change in body weight between w1118 and Sirt6−/−bck−L1 flies across yeast concentrations. (d, e) Representative plot for starvation survival in 3–5 day old w1118 flies reared under differential concentration of yeast (d) and glucose (e) diets, as indicated (n = 8 with 10 flies per n). (f, g) Representative plot for starvation survival in 3–5 day old Sirt6−/−bck−L1 flies reared under differential concentrations of yeast (f) and glucose (g) diets, as indicated (n = 8 with 10 flies per n). (h) Maximum survival under starvation in w1118 and Sirt6−/−bck−L1 flies reared on differential concentrations of yeast and glucose diets, from three independent experiments. Asterisks indicate comparison with w1118 grown on ND and hashtags depict comparison between w1118 and Sirt6−/−bck−1 for the particular diet, as indicated. (N = 3, n = 8 with 10 flies per n). (i) Quantitative PCR analysis for change in gene expression post 48 h of starvation in 3–5 day old w1118 and Sirt6−/−bck−L1 flies, gown under differential concentration of yeast and glucose, as indicated. $statistical significance between w1118 and Sirt6−/−bck−L1 flies under both fed (black vs. red) and in response to 48 h starvation (grey vs. pink), within a diet group. *statistical significance between fed and 48 h starved flies for each genotype (black vs. grey and red vs. pink), within a diet group. #statistical significance with respect to control diet (ND) across diet regimes (comparison within each coloured cohort). Student's t‐test and two‐way ANOVA were used to analyse statistical significance of the data (*, #, $ p < 0.05, **, ##, $$ p < 0.01 and ***, ###, $$$ p < 0.001)