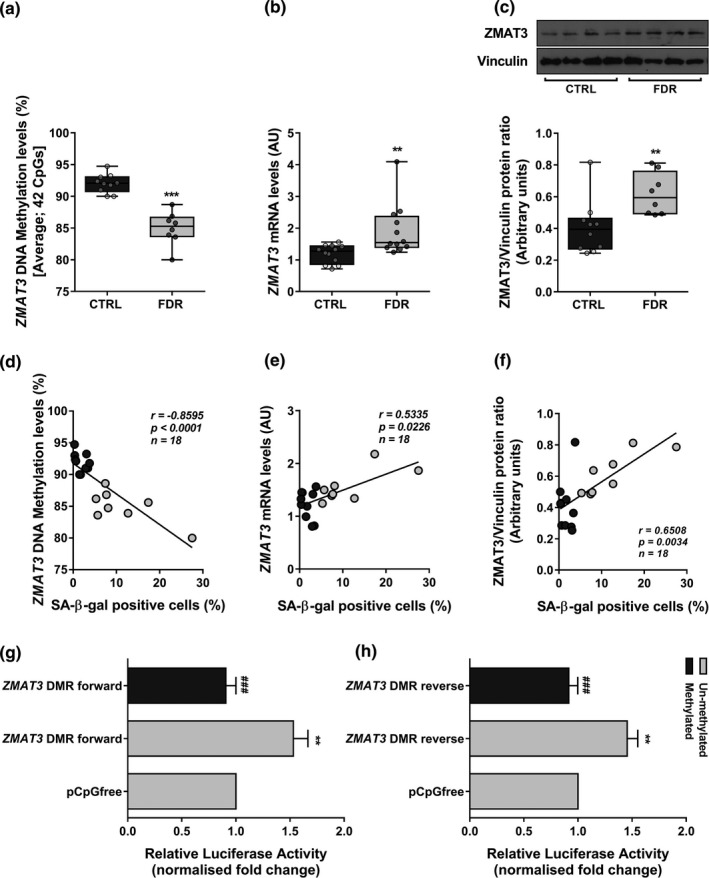
FIGURE 2.

DNA methylation and expression of ZMAT3 in APC from FDR and CTRL. (a) Changes in average DNA methylation levels at 42 CpGs within the ZMAT3 DMR were detected by bisulfite sequencing (BS) in APC from FDR (n = 8) and CTRL (n = 10) subjects available from our study cohort. (b) The ZMAT3 mRNA levels were measured by qPCR and normalized to RPL13A expression in APC from FDR (n = 12) and CTRL (n = 12) subjects. Data are presented as absolute units (AU). (c) The ZMAT3 protein levels were assessed by Western blot in APC from FDR (n = 8) and CTRL (n = 10) subjects available from our study cohort. Vinculin served as a loading control. The upper figure shows representative blots; the lower figure shows result quantitation. (a‐c) Data are shown as boxplots (min‐max) with all individual values. Significance was determined by unpaired Student's t‐test (a) or Mann–Whitney test (b,c). **p < 0.01, ***p < 0.001 vs CTRL. (d‐f) Correlation between the percentage of SA‐β‐gal‐positive cells and ZMAT3 DNA methylation or mRNA or protein levels in the same APC samples from FDR and CTRL. Spearman's correlation coefficient r, p value, and number of samples (n) are indicated in the graph. Dark gray circles represent CTRL; light gray circles represent FDR. (g,h) The ZMAT3 DMR was cloned into a luciferase reporter vector devoid of CpGs in both forward (ZMAT3 DMR forward) and reverse (ZMAT3 DMR reverse) orientations. These constructs were either methylated or mock‐treated (un‐methylated). The results were normalized using a co‐transfected renilla luciferase control vector and are presented as fold change relative to the mock‐treated empty vector (pCpGfree). Data are shown as mean ±SEM of three independent experiments. Significance was determined by one‐way repeated measures ANOVA followed by Tukey's multi‐comparison test. **p < 0.01 versus pCpGfree; ###p < 0.001 vs un‐methylated ZMAT3 DMR forward (g) or un‐methylated ZMAT3 DMR reverse (h)
