FIGURE 5.

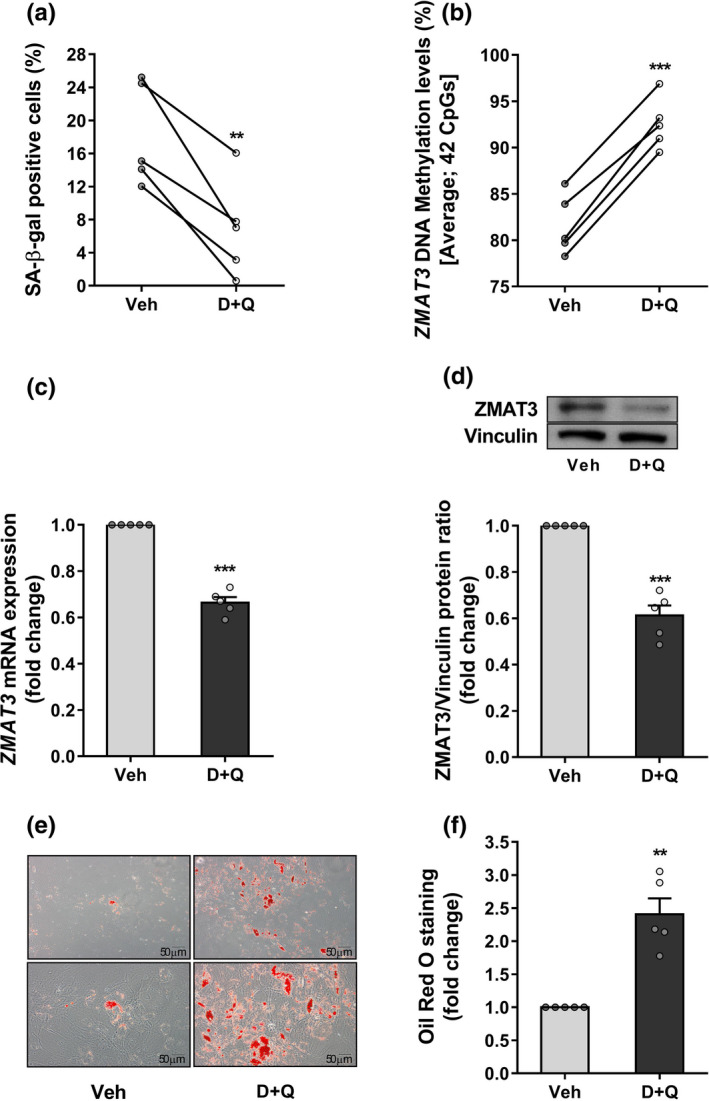
Effects of senolytics on ZMAT3 DNA methylation and adipocyte differentiation in FDR APC. Five biologically independent APC samples randomly selected in the FDR group were treated with D+Q or vehicle (Veh) for 72 h. (a) Flow cytometric detection of the SA‐β‐gal‐positive cells in FDR APC treated with D + Q or Veh. Values are presented as percentage (%). (b) Changes in average DNA methylation levels at 42 CpGs within the ZMAT3 DMR were detected by BS in D+Q‐treated FDR APC compared to Veh‐treated FDR APC. (c) The fold change of the ZMAT3 mRNA was assessed by qPCR. Expression was normalized first to RPL13A and then to expression in Veh‐treated FDR APC. (d) The fold change of the ZMAT3 protein was measured by Western blot in D + Q‐ versus Veh‐treated FDR APC. Vinculin served as a loading control. The upper figure shows representative blots; the lower figure shows result quantitation. (e,f) After either D+Q or Veh treatment, the FDR APC were differentiated for 15 days. Oil Red O staining was used to assess the degree of differentiation. (e) Representative microphotographs showing lipid accumulation of FDR APC treated with D+Q (right) or Veh (left) at diff. day 15. Upper panel at 10x magnification; bottom panel at 20x magnification. Scale bar 50 μm. (f) Bar graph shows photometric quantification of Oil Red O staining measured at 490 nm. Results are normalized to the absorbance in Veh‐treated FDR APC. (a,b) Data are shown as scatterplot with lines joining paired points. (c,d,f) Data are shown as mean ±SEM. Dots represent individual level data. (a‐d,f) Significance was determined by paired Student's t‐test. **p < 0.01, ***p < 0.001 versus Veh
