FIGURE 6.

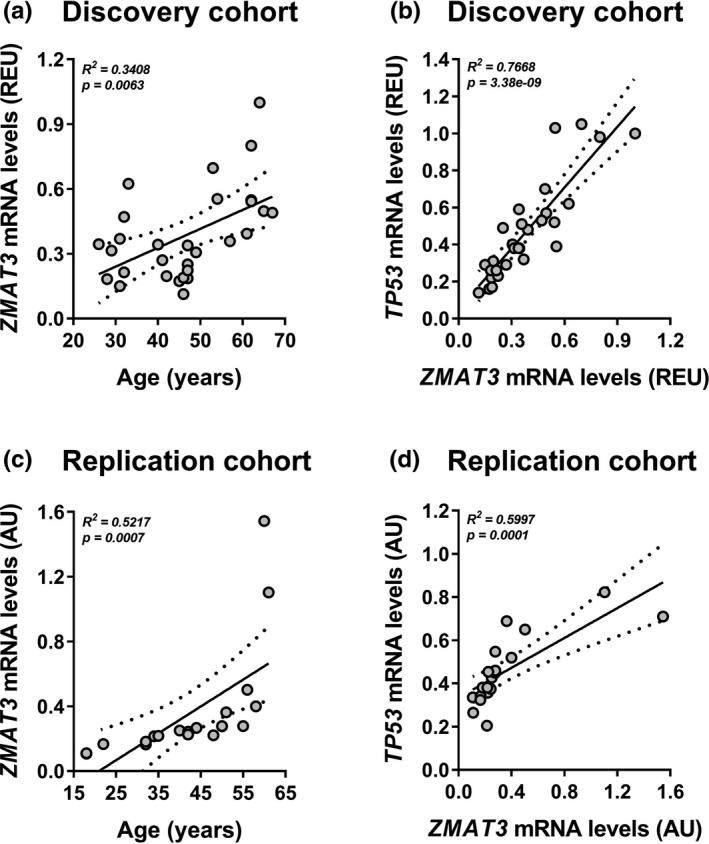
Age and senescence association with ZMAT3 expression in SAT. (a,b) ZMAT3 and TP53 mRNA levels were measured by qPCR in subcutaneous adipose cells from 29 individuals aged 26 to 67. Values are presented as relative expression units (REU). (a) Scatter plot shows the association between the age of study participants and ZMAT3 mRNA levels (regression coefficient = 0.0080, adjusted for BMI). (b) Scatter plot depicts the association between ZMAT3 and TP53 mRNA levels in subcutaneous adipose cells (regression coefficient = 1.1004, adjusted for BMI). (c,d) ZMAT3 and TP53 mRNA levels were measured by qPCR in SAT from 20 women aged 18 to 61. Values are presented as absolute units (AU). (c) Scatter plot shows the association between the age of study participants and ZMAT3 mRNA levels (regression coefficient = 0.0186, adjusted for BMI). (d) Scatter plot depicts the association between ZMAT3 and TP53 mRNA levels in SAT (regression coefficient = 0.3558, adjusted for BMI). (a‐d) The association analyses were adjusted for BMI by using multiple linear regression models. R2 and p values for the whole models are shown in the graphs. Dashed lines indicate the 95% confidence intervals for the regression line
