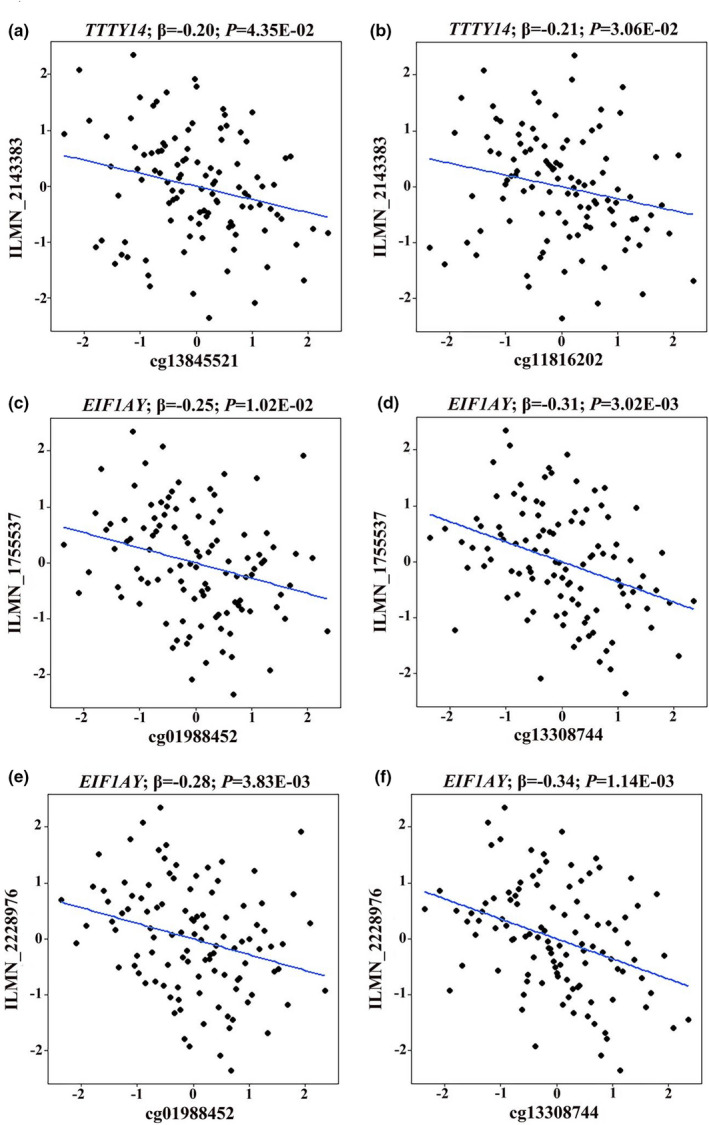
FIGURE 2.

Methylation‐expression correlations for age‐related CpGs on ChrY. (a) and (b) correlations of cg13845521 and cg11816202 with the expression level of TTTY14 (probe ILMN_2143383); (c) and (d) correlations of cg01988452 and cg13308744 with the expression level of EIF1AY (probe ILMN_1755537); (e) and (f) correlations of cg01988452 and cg13308744 with the expression level of EIF1AY (probe ILMN_2228976). Only methylation‐expression correlations with p < 0.05 were presented
