
FIGURE 2.
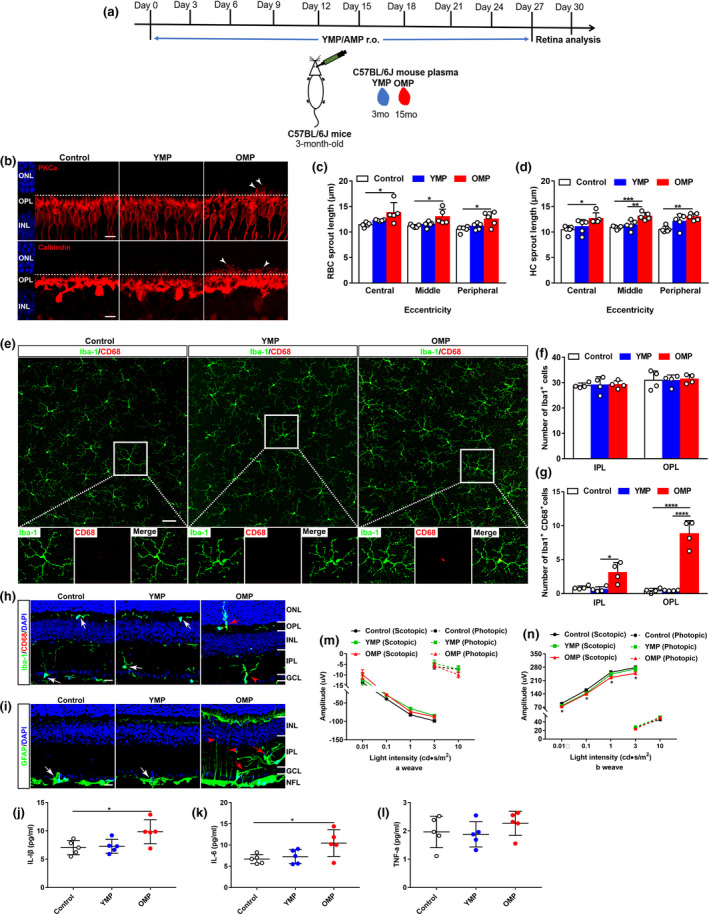
Old plasma injection induces age‐related dendritic sprouting, inflammation, and functional decline in young mouse retinas. (a) Schematic representation of the experimental design. Young mouse plasma (YMP) from young C57BL/6J mice (3 months) or old mouse plasma (OMP) from aged C57BL/6J mice (15 months) were retro‐orbitally injected into young C57BL/6J mice (3 months) for a total of ten times, 3 days apart, and retinas were collected for further studies at day 30. Mice in control groups received the same volume of phosphate‐buffered saline (PBS; pH 7.4) at the same time points. (b) Confocal images of RBCs (top row) and HCs (bottom row) in retinal sections from young mice after YMP or OMP treatment. Arrowheads indicate the aberrant dendritic sprouting of RBCs and HCs. Scale bars, 10 µm. (c–d) Quantification of the aberrant dendritic length of RBCs and HCs in young retinas after YMP or OMP treatment. Data were presented as mean ± SEM and analyzed by one‐way ANOVA with Tukey's multiple comparison test, n = 5 mice in each group. (e) Retina wholemounts from young mice after YMP or OMP treatment were stained with Iba‐1 and CD68. Confocal images focus on the OPL. The boxed regions are highly magnified at the bottom showing the colocalization of CD68 with microglia. Scale bars, 50 µm. (f–g) Quantification of the numbers of Iba‐1+ and of CD68+Iba‐1+ microglia in the IPL and OPL of whole‐mounted young retina after YMP or OMP treatment. Data are presented as mean ± SEM, n = 4 mice in each group. One‐way ANOVA analysis with Tukey's multiple comparison test. (h) Retina sections from young mice after YMP or OMP treatment were stained with Iba‐1 and CD68. White arrows indicate CD68‐negative microglia. Red arrowhead indicates CD68‐positive microglia, and red arrow indicates the dendritic extension of activated microglia from their original titled OPL to the ONL. Scale bars, 20 µm. (i) Retina sections stained with GFAP antibody. White arrows show the resting astrocytes. Red arrows show activated astrocytes, and red arrowheads indicate activated Müller cells. Scale bars, 20 µm. (j–l) ELISA analysis of pro‐inflammatory cytokines IL‐1β, IL‐6, and TNF‐α in young retinas after YMP and OMP treatment. Data are presented as mean ± SEM (n = 5 mice in each group) and analyzed by one‐way ANOVA with Tukey's multiple comparison test. (m–n) ERG recordings on young mice after YMP or OMP treatment. Data are presented as mean ± SEM (n = 12 mice in each group) and analyzed by one‐way ANOVA with Tukey's multiple comparison test (control vs. OMP, *p < 0.05)